Sir Graham Brady recently argued the case for expanding grammar schools in Schools Week which reported:

This makes two factual claims
- The number of grammar schools has reduced.
- Grammars are less inclusive due to population growth in existing selective areas.
Brady’s claims are put to the test here with three graphs.
Fewer grammar schools?
The School Standards and Framework Act 1998 prevents the creation of new grammar schools. After its introduction, the number of grammar schools remained fixed at 164 until 2013 when Ofsted inadequate Chatham Boys merged with Clarendon Girls. Both schools had operated as single school on two sites in Ramsgate since 2009. Following the merger, for purely administrative purposes the National Pupil Database now only records 163 grammar schools, but the last time any existing school stopped being selective was in 1998 when, following a campaign by parents and teachers, Bristol converted its two remaining grammars to comprehensives.
‘Selective areas’.
Nine local education authorities (LEAs) were defined in Schedule 1 of the Education (Grammar School Ballots) Regulations 1998 as selective areas. Since then, Wirral and Sutton have increased proportions of grammar school children beyond 25%. These two LEAs have been added to the original list and proportions of grammar school children in each plotted over time:
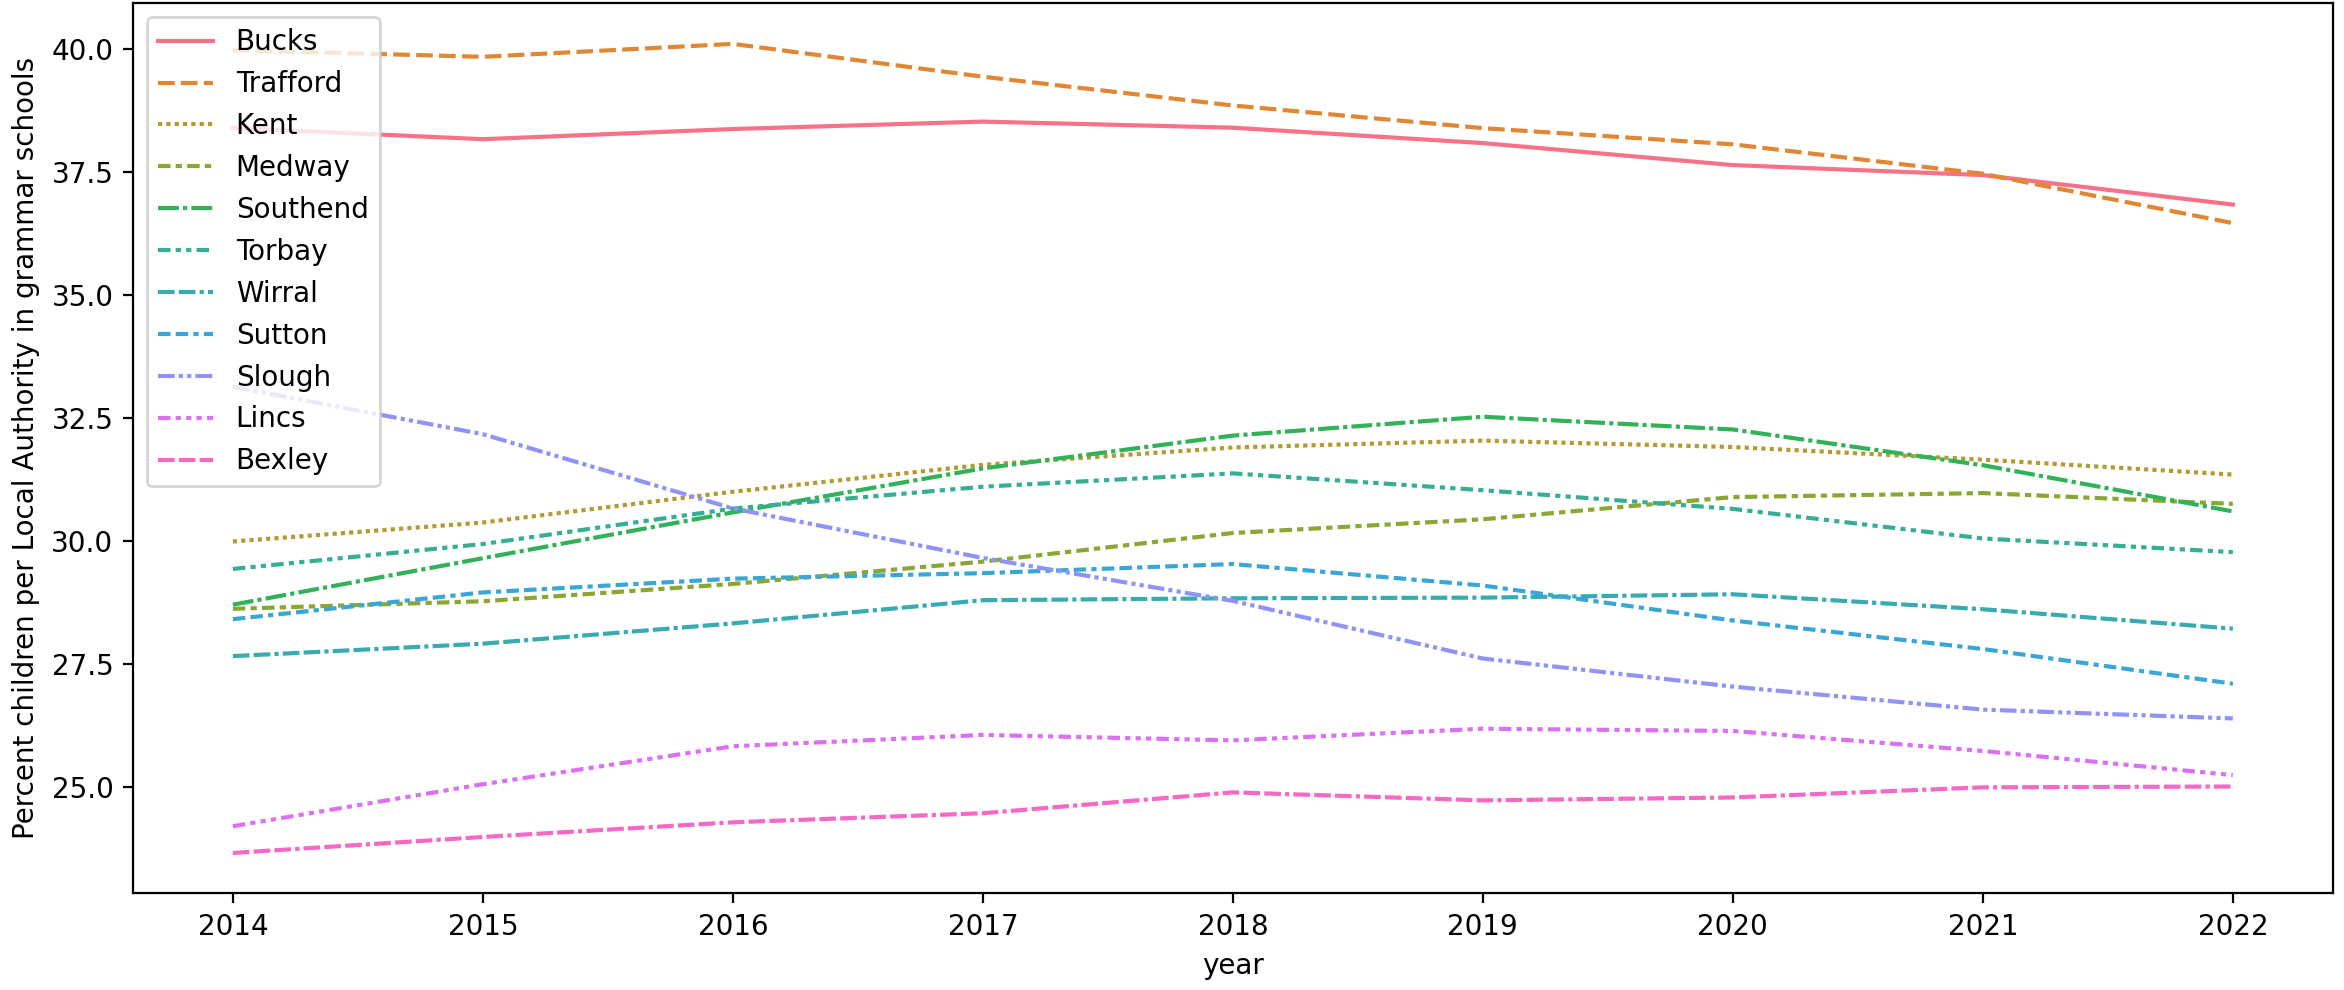
The proportion of children attending grammars in Bucks and Trafford has tailed off but still remains well over a third (36.8% and 36.5% respectively). Critics argue that even removing the top 25% by ability is damaging to neighbouring secondary modern schools. By 2022, 30.22% of children in the 11 selective areas were attending grammar schools.
Grammars ‘forced to become more selective’?
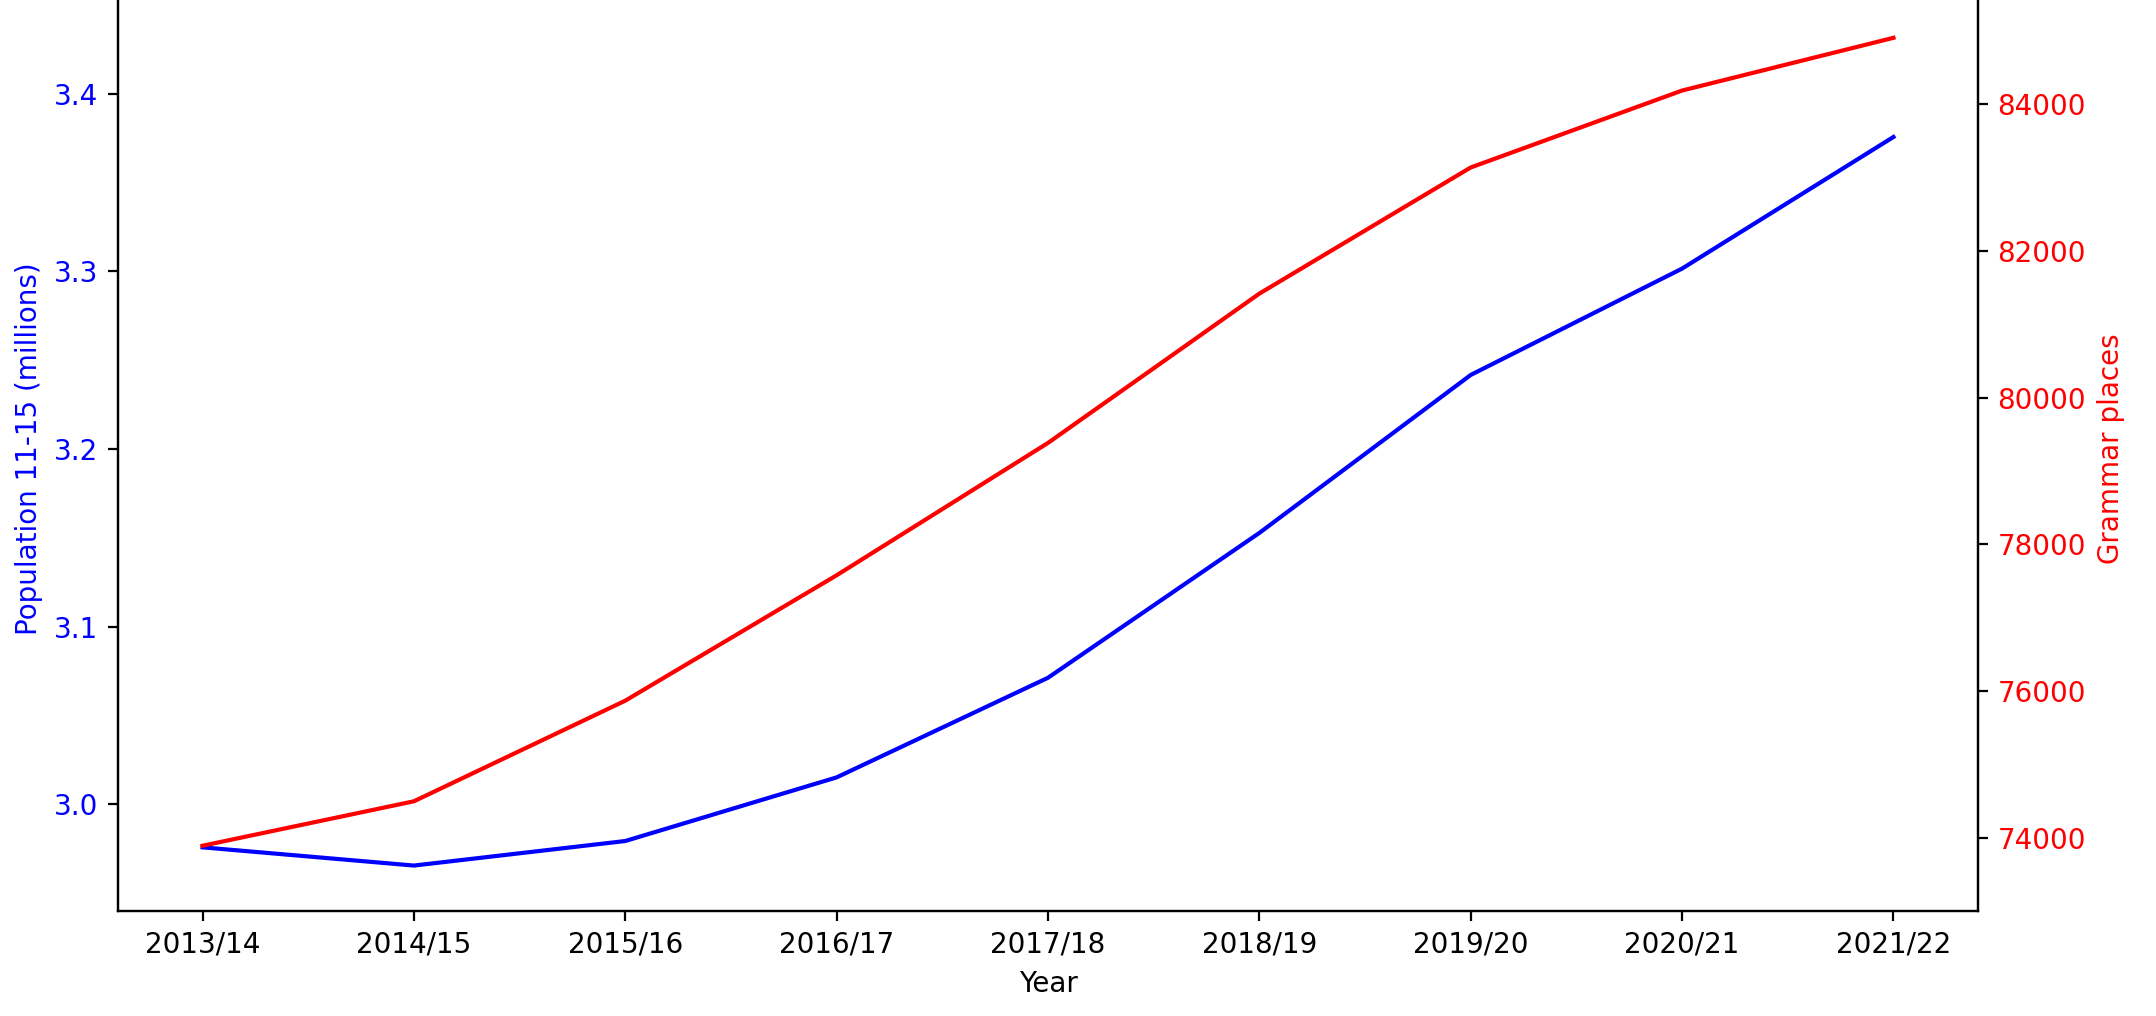
Brady states growth in population has forced grammars to become more selective. Since 2013/14, pupil numbers have grown by 13.43%. However, over the same period the number of children attending grammars in selective areas increased even further, by 14.91%.
Possible explanations
Creation of new grammar schools is prohibited by primary legislation, so how did this happen? In 2018 Schools Week reported that the government had been funding grammar school expansion “through the back door” using the Condition Improvement Fund (CIF). 40% of secondary school recipients were grammars, even though they only make up 5% of schools.
In 2018 the government set up the Selective Schools Expansion Fund (SSEF). This set aside £50m/year to expand grammar schools in return for strict undertakings they become more inclusive. Schools minister Nick Gibb, confirmed grammars would no longer be able use CIF to increase pupil numbers. This made the process less opaque, but years after these grants were awarded the DfE still refuses to publish full details of public funding of grammar school expansion.
Since 2014 grammar school expansion has outstripped growth in pupil numbers by about 11%, but what about inclusivity?
Inclusivity
Brady says demographic changes have forced grammars to become less inclusive. In 2013, Cribb et al examined grammars’ inclusivity and found, “Less than three per cent of all pupils going to grammar schools are entitled to free school meals, against an average of 18% in other schools in the areas where they are located.” Chairman of the Sutton Trust which sponsored this research, Sir Peter Lampl, provided a foreword concluding, “… opening up grammar schools would transform social mobility …” This graph shows grammars’ subsequent track record on inclusivity.
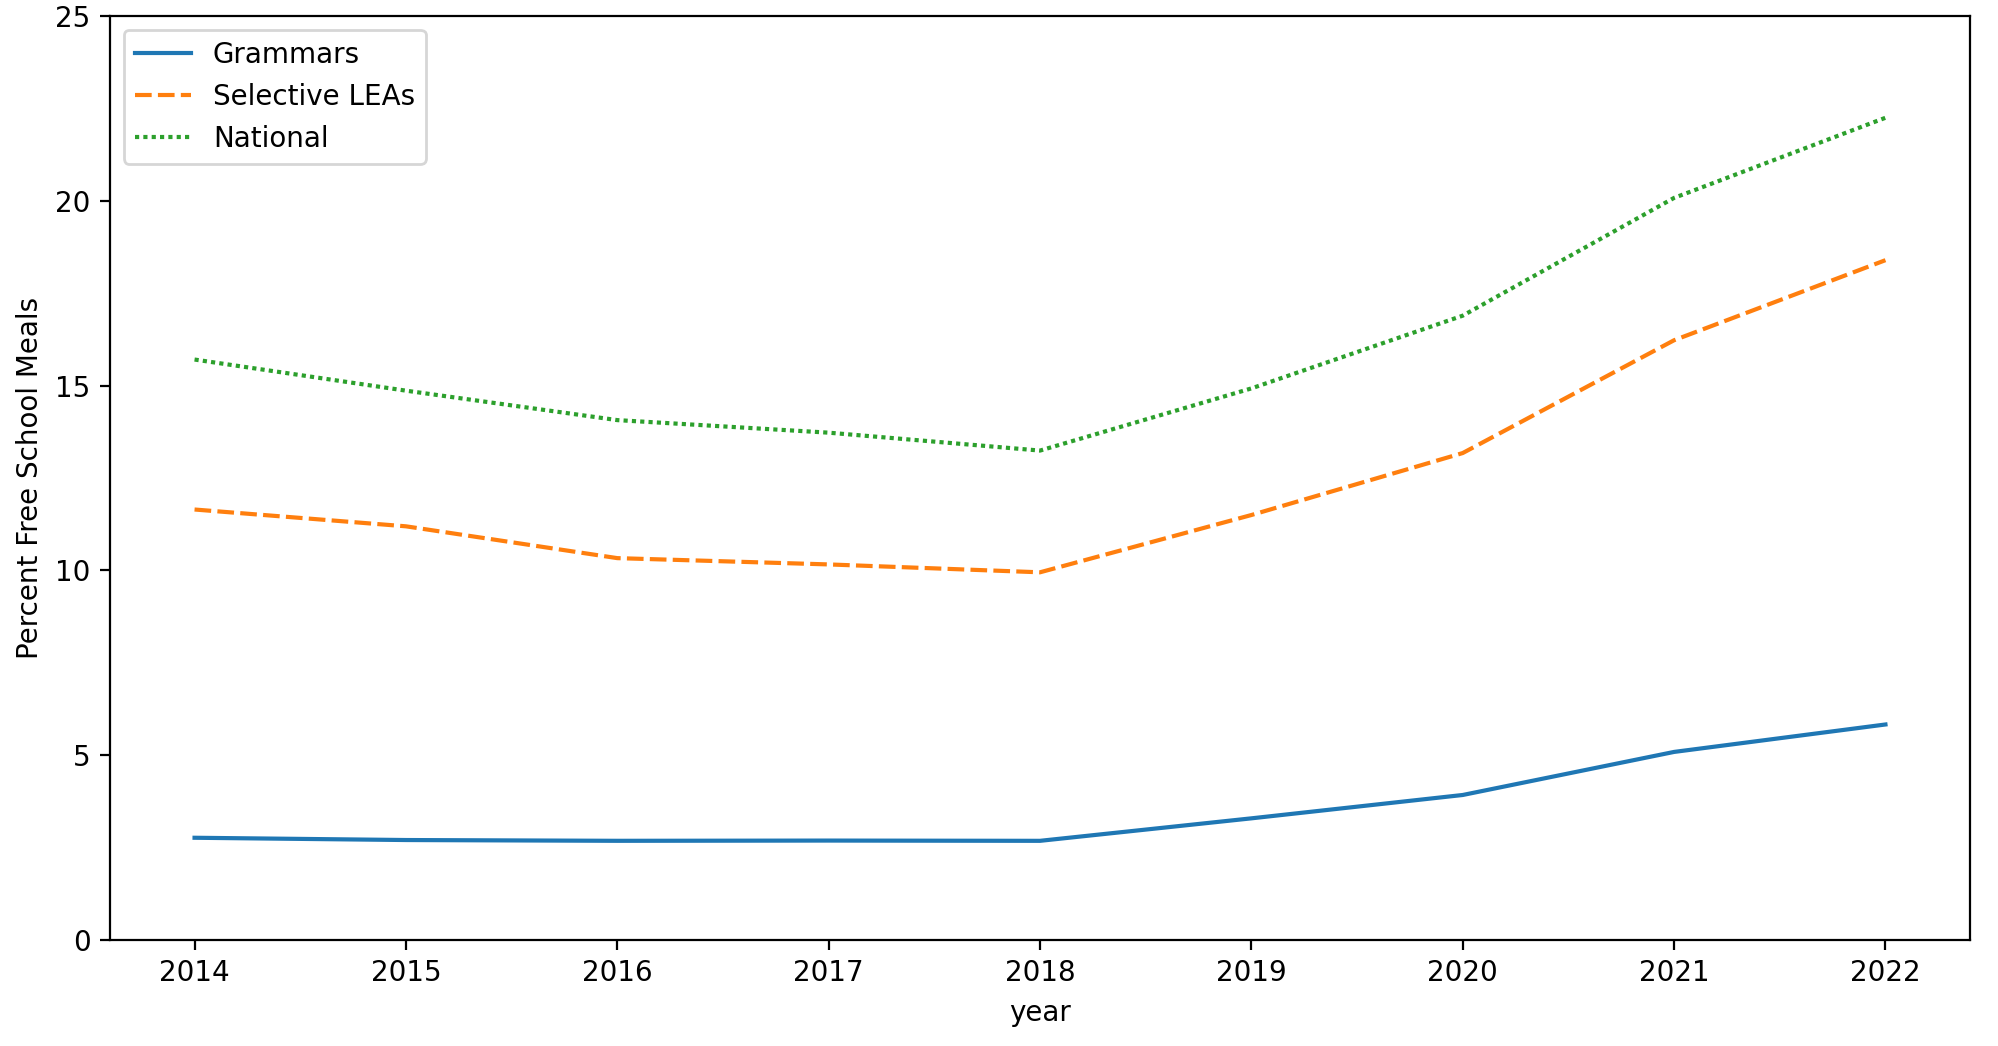
The proportion of disadvantaged children admitted to grammars remained level at around 2.7% until 2018. Since then, it has grown to 5.8%. However, this merely reflects the wider increase in child poverty.
Is inequality underestimated?
In comparing grammars against other schools in the areas where they are located Cribb et al may have inadvertently underestimated the degree of inequality. Andrews et al (2016) found parents are prepared to send their children twice as far to grammar schools. It follows that selective areas experience net inward ‘migration’ of affluent children making a comparison of just those children educated within each LEA unrepresentative.
Grammars’ inclusivity should be compared against national figures. Almost a decade after Cribb et al highlighted this issue, grammars still only admit 5.8% disadvantaged pupils compared against 22.9% nationally. The Sutton Trust may argue that grammars promote social mobility, but that is of little benefit if disadvantaged children are four times less likely to be admitted in the first place.
The need for honesty
The Prime Minister has instructed her ministers to draw up plans to reintroduce grammar schools. She has given Kelly Tolhurst responsibilities which include “standards and selection” as well as “disadvantaged and vulnerable children”. That will be a difficult circle to square!
Arguments about whether selection improves social mobility are covered well elsewhere. But if the government intend to retrospectively legitimise an already established policy of grammar school expansion through primary legislation, it is essential they are honest about the facts and robustly challenged when they are not.
Appendix: Data and extraction
The data was extracted from census data dating back to January 2014. The code and data used to create the tables and plots is downloadable from https://github.com/jamescoombs3/SchoolsPupilsCharacteristics
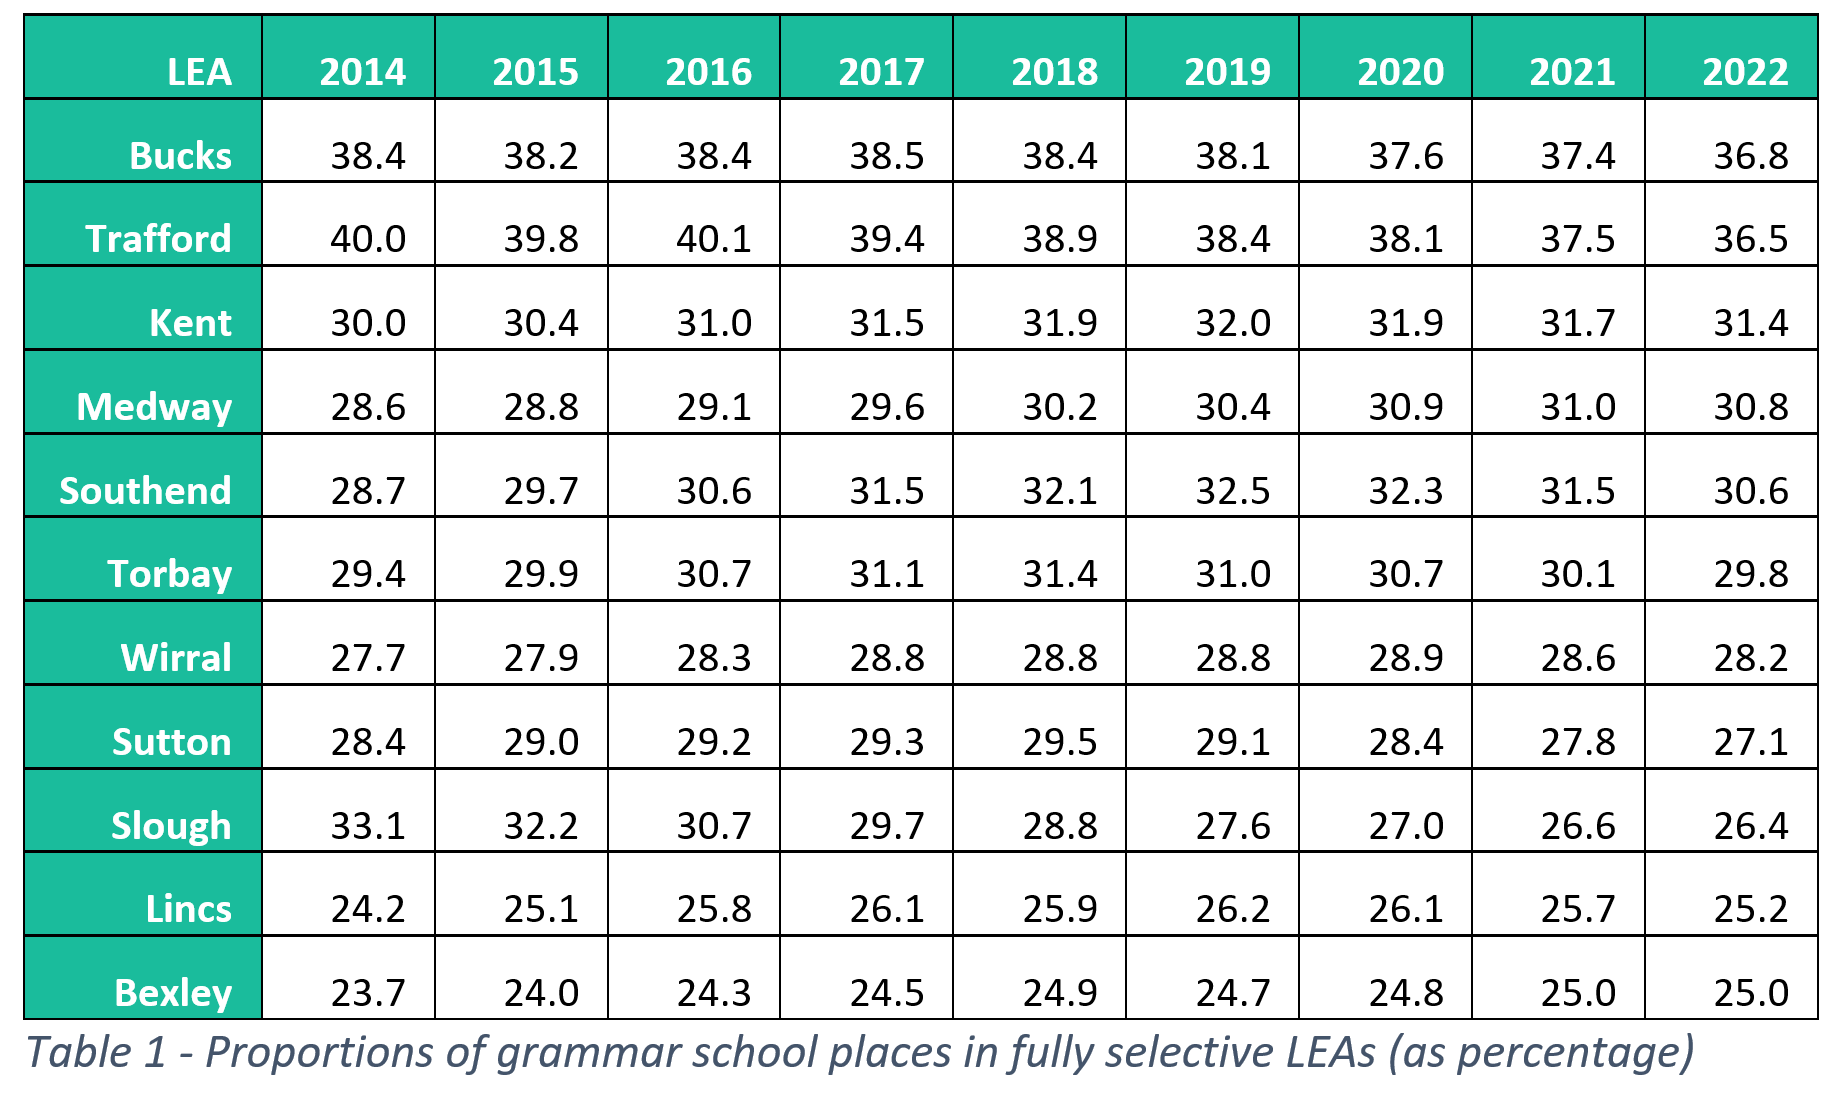
The following tables contain the values used in the plots above.



Recent Comments