Someone recently drew my attention to an article accusing Kent County Council’s 11-plus test provider of “age discrimination” in the way they calculated age weighting.
Part of the issue is grammar schools refuse to be open and transparent about how raw 11-marks are converted into the “standardised” scores used for admissions. There are two parts to this; age weighting and “standardisation“. The driving reason for the secrecy seems to be so they can modify the number of children passing the test whilst outwardly appearing to maintain a consistent qualifying score. The Guardian found that over five years, grammars increased their intake by 5.4% even though numbers taking the test only grew by 2.4%. The lack of transparency in the way 11-plus tests are processed is truly reprehensible, but is there any truth in the “age discrimination” claim?
Age Weighting
Children normally take the test when they are 10 years old. The difference in age between the youngest and oldest can amount to 10% of their entire life. Unsurprisingly, there is a small but statistically significant improvement in children’s scores as they get older. Age weighting simply measures this then adjusts for it.
To objectively evaluate “age discrimination” in the 2020 Kent test we need to compare the pass rates for each month. Fortunately, the original data is available here. This has been extended to calculate pass rates per month. These data were then plotted and a trend line added. The final spreadsheet is available here.
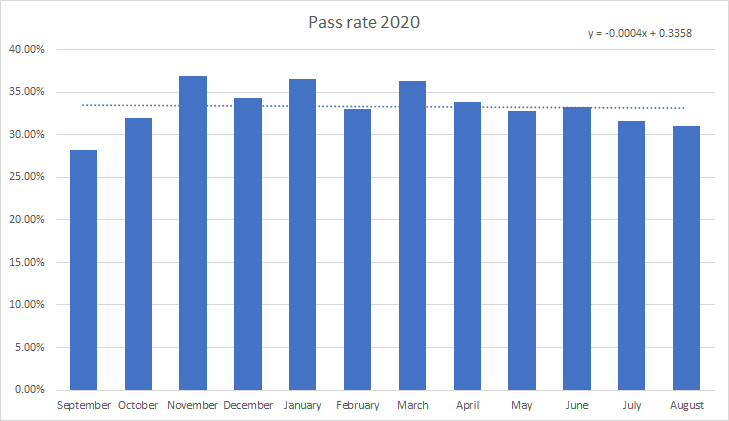
The 2020 trendline is almost perfectly horizontal. There is absolutely no evidence of “age discrimination”. There is some variation, but this is real data. The overall pass rate is 33.36%. That might seem high for a test intended to select the top 25%, however the Kent test is ‘opt in’. Those sitting it are self-selecting and should demonstrate a higher attainment than the overall population.
The blog author aggregates the data to quarters, reducing it from 12 samples to four. He then selects two he claims demonstrate “age discrimination”. Throwing away data is generally a bad thing. In this case it’s a moot point given his figures range from 16.2% to 19.2% – about half the true values – and bear no discernible relationship to the data they are purported to come from.
Cherry picking data out of context can be used to argue the exact opposite – that September born children were prejudiced against. Their pass rate is about 2σ below the mean. The probability of that happening by chance is 3.4% but this is real data. It did happen. In 2020. Age weighting is not there to ensure a nice spread of birthday parties across the full calendar year (although it does tend to have that effect).
Standardisation
The other part of the overall process is referred to as “standardisation”, although that is often taking an awful liberty with the language. By convention, test providers scale the results so they have a mean of 100 and standard deviation of 15 resulting in this distribution:
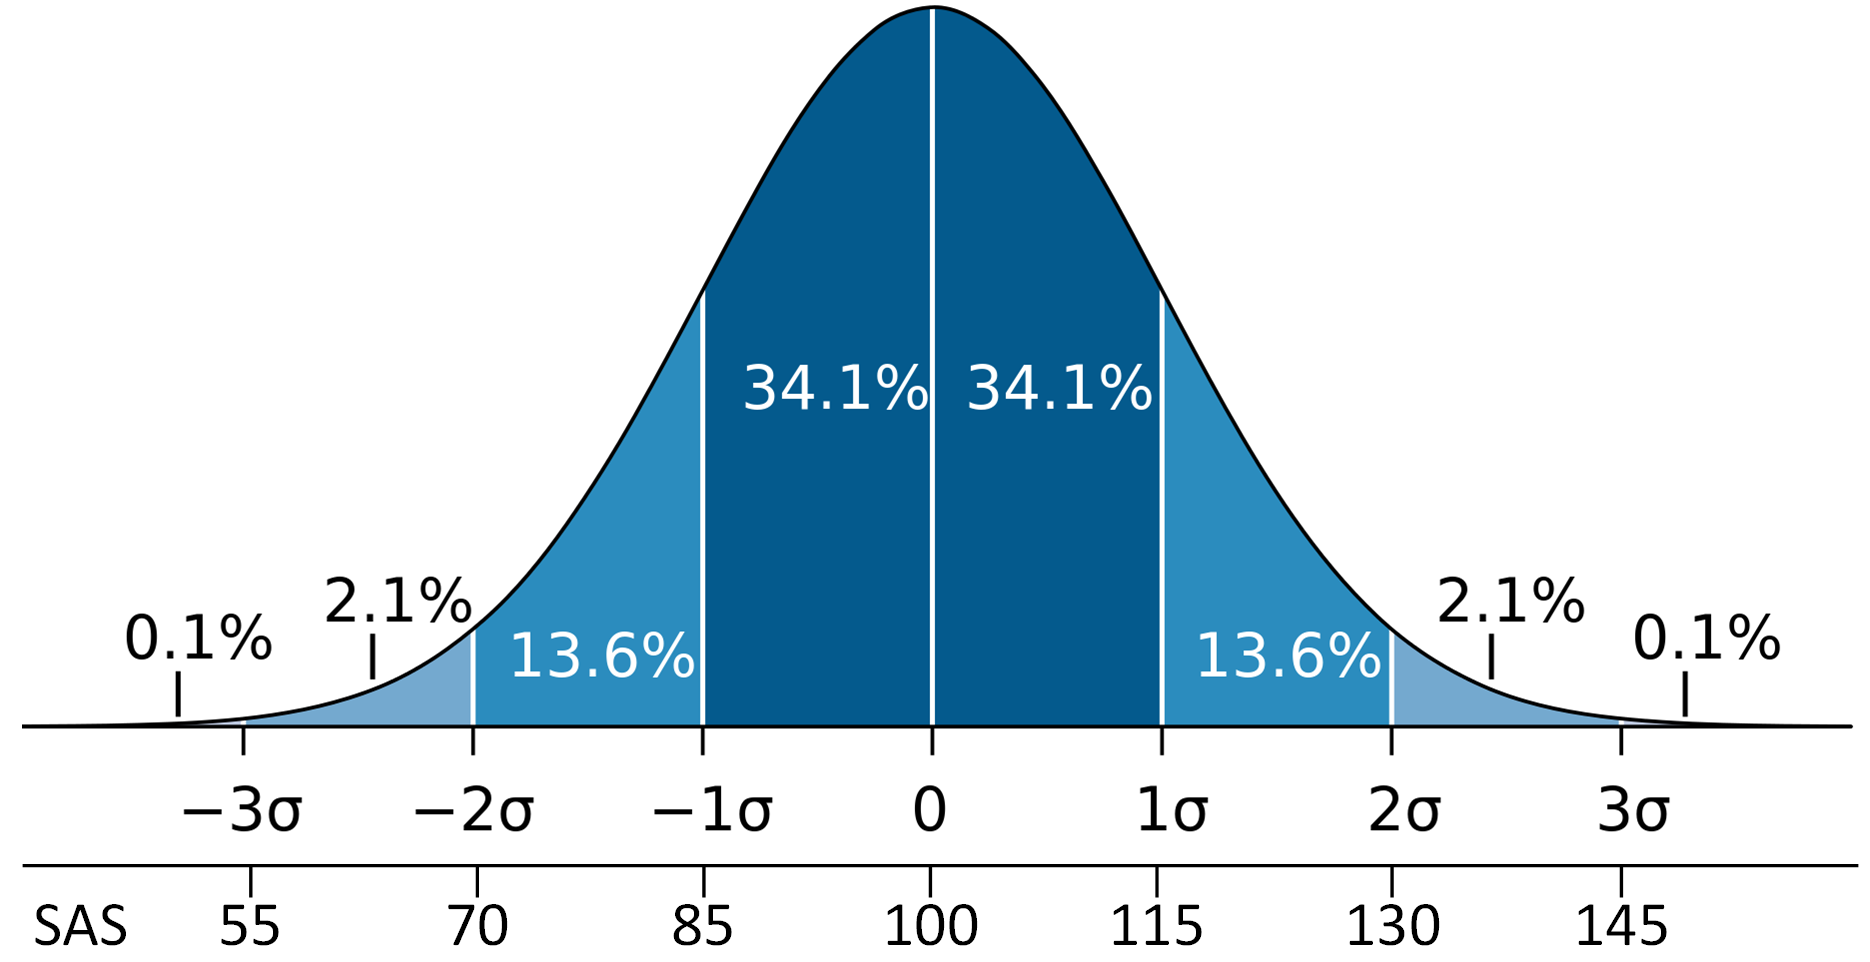
A lot of 11-plus tests do follow this convention, but in 2018 TES exposed Bucks grammars trying to conceal “alternative standardisations”. Evidence submitted in court shows Bucks used parameters which were anything but standard!
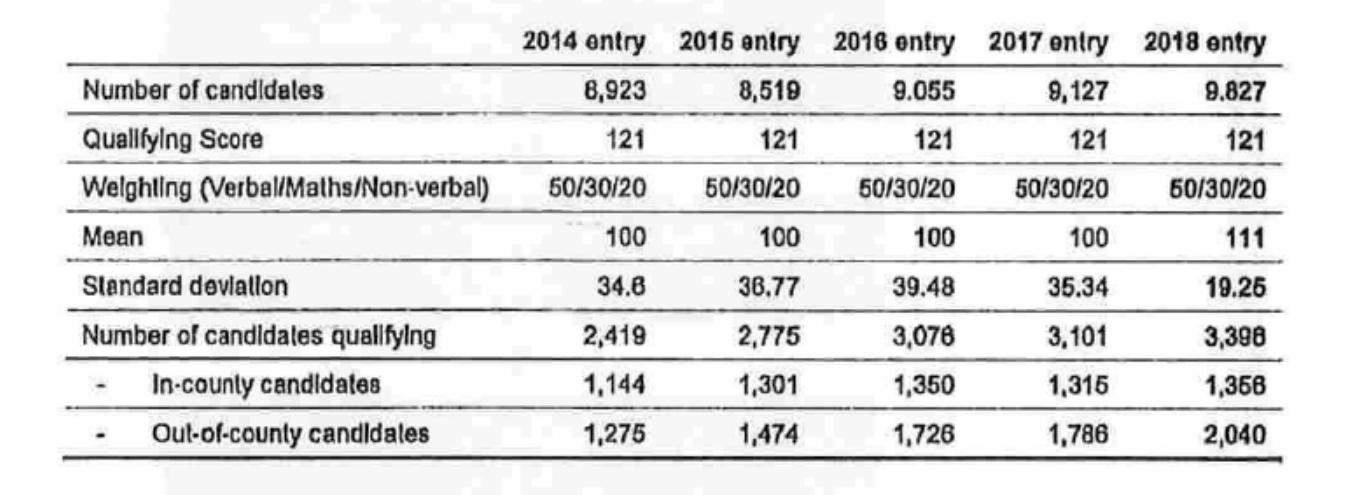
One way to visualise what’s going on with these numbers is to imagine the x-axis on the bell curve above written on a piece of rubber which can be stretched, shrunk and in 2018 was completely shifted sideways. Outwardly, the Bucks grammars maintained a “fixed” qualifying score of 121. Behind the scenes they changed the parameters to gerrymander their admissions numbers.
I’ve been threatened with a Strategic Lawsuit Against Public Participation (SLAPP) for merely explaining age-weighting using data disclosed by the responsible public authority. Volunteers at whatdotheyknow.com were similarly threatened. If grammar schools were open and transparent about this process we wouldn’t have nutty conspiracy theories such as this “age discrimination” one filling the void they have created in public understanding.

Leave a Reply