Over the years I have had numerous legal disagreements with the Information Commissioner. It may therefore seem surprising that I have enormous respect for the essential work the regulator does to help us all hold public authorities to account over how they spend our money. The single most common reason government agencies give to withhold information is disclosure might prejudice service providers’ commercial interests. The outcome of this appeal might make it harder in future for public to use that as an excuse to avoid openness and transparency. Although the judicial process is adversarial, I’m hopeful we have some common ground with the Commissioner. To explain why, I first need to set the scene.
Special Educational Needs and Disability (SEND)
By law, local authorities must issue Education and Health Care Plans (EHCPs) within 20 weeks. A rapid rise in demand has left councils across the country struggling to meet these statutory targets. Last month the government published its white paper aimed at wider reforms: Special Educational Needs and Disability (SEND) Reform.
Government statistics show that in 2020 Leeds Council’s compliancy with the statutory 20-week period was 88.8%. By 2024 this figure had dropped to 9.3%. The council paid Price Waterhouse Cooper (PwC) £749,000 in management consultancy fees to produce a report on how they could improve compliancy. It may have been better for Leeds to spend this money directly supporting children. We don’t know because the council refused to disclose the report. The parents who gave up their time and emotional capital to contribute the essential input PwC needed to produce their report did so in the expectation that the council would disclose it and use this to drive systemic improvements for others.
Leeds argued that other councils would be less likely to ask PwC to provide management consultancy on how to meet their statutory SEND obligations if this information was already in the public domain. The Information Commissioner upheld their decision. Mr Khan, who originally requested disclosure, appealed to the First Tier Tribunal. The Tribunal does its best to support “litigants in person”. However, speaking from personal experience, the process can be terrifying and few people know how to present a legal argument. I learnt through trial and error. Mainly the latter. Representation can make a huge difference, but legal advice is expensive. Victorian Court of Appeal Judge, Lord Mathew, quipped, “In England justice is open to all, like the Ritz hotel.” That observation has stood the test of time.
I am by no means qualified but have some past successes such as my challenge to former immigration minister Robert Jenrick’s decision that the Home Office should withhold a report into the historic roots of the Windrush scandal. The ensuing appeal resulted in the judge comparing the government’s attempts to control information to Orwell’s 1984, a reiteration of Santayana’s warning that, “Those who cannot remember the past are condemned to repeat it“, and some coverage in the Guardian.
Philosophically, my position is the neoliberal prioritisation of commercial interests damages public services such as health care, education, and social welfare, increases inequality, and reduces democratic accountability. For an example, look no further than the privatisation of water companies. The claimed commercial prejudice in this appeal is based on entirely speculative, future earnings. A more cynical interpretation is that disclosure would prevent PwC from reselling the same old bit of rope they had already been given three quarters of a million pounds of public money for. To even begin to address the issues with SEND provision, the first essential step is for Leeds council to disclose this report. For that reason, I agreed to represent Mr Khan.
Freedom of Information
The way the Freedom of Information Act works is public authorities must disclose requested information unless one or more “exemptions” applies. These can be “absolute” or “qualified”. A request from the Kremlin to disclose the location of the UK’s submarines would rightly be refused under s.24 to safeguard national security. That exemption is absolute. However, the exemption used by public authorities to refuse disclosure more than any others is s.43(2) – prejudice to commercial interests. This is qualified meaning the public authority must consider not just the commercial interests but also whether the wider public interest lies in disclosure.
We conceded a hypothetical possibility that PwC could profit from charging other councils for management consultancy which Leeds council had already fully reimbursed them for, but maintained the public interest in improving support for vulnerable children far outweighed that. We lost. The First Tier Tribunal concluded that disclosure would place additional financial burden on the council. This was unexpected as the council’s financial interests are entirely separate to PwC’s commercial interests which the council’s refusal was based on.
Appealing to the Upper Tribunal
There is a high bar to obtaining permission to appeal any court decision. The appellant must demonstrate that the lower court “erred in law” and this had a material impact on the outcome. The court’s permission on whether an appeal can precede or not is binary, but the way they word it can be informative. The Upper Tribunal granted permission to appeal on all the six grounds submitted putting the onus very much on the Information Commissioner to argue why Leeds council should continue to withhold the information. Within those grounds I make three submissions on the interpretation of the law.
The first relates to how public authorities should apply the public interest test. Specifically, we submit that when Parliament drafted the Freedom of Information Act, they produced a finite list of all the valid reasons for withholding information. It follows that any arguments for withholding information must specifically relate to the claimed exemption. To put that in the context of this appeal, the First Tier Tribunal concluded that disclosure would prejudice PwC’s commercial interests but in their balancing the arguments they considered the financial impact on Leeds council. The “orthodox” position taken by several First Tier Tribunals is that public interest arguments in favour of withholding information must specifically relate to the exemption, although these decisions are not legally binding on others.
The second relates to whether the council’s interests are commercial or financial. Here we relied on the Court of Appeal decision (Department for Work and Pensions v Information Commissioner and Zola [2016] EWCA Civ 758). The CoA rejected the DWP’s argument that any additional costs in providing public services they might incur due to disclosure would be “commercial”. This may seem pedantic, but there is no exemption in the legislation covering financial prejudice. The decision by Judge Harris which we are appealing states, “The authority relied on appears to be simply legal argument which was not accepted by the judge in that case.” We respectfully disagree.
The third point relates to something called the public interest timing point. The courts have confirmed public authorities must consider the public interest needs at the point in time they refuse to disclose information. Over seven hundred and fifty people have signed a petition asking the council to disclose the report. The Tribunal rejected this evidence because it postdated the council’s refusal. It is hard to imagine how parents would sign a petition protesting about a decision they consider negatively impacts them before the council made it! In granting permission to appeal, Upper Tribunal Judge Stout pointed out this was, “evidence of actual public interest in its release at the time of the request, even if that interest was not expressed until after the date of the Council’s decision.”
Conclusion
After Judge Stout granted permission to appeal I wrote to the Information Commissioner asking to what extent we could agree on the three points described above. Agreeing on the law does not prevent the Commissioner arguing the facts of this case warrant Leeds continuing to withhold the information. I am confident we should find common ground because my arguments are all derived from the excellent guidance the Commissioner publishes on his website. He in turn bases his guidance on his detailed analysis of past judicial decisions. The one drawback with the ICO guidance is often the only available precedents are First Tier Tribunal rulings which are not legally binding. Any agreement we can reach will:
Reduce the burden on the Upper Tribunal.
Enable the Commissioner to modify his guidance on these specific points of law so it is based on a legally binding ruling.
Help us to argue that Leeds council should publish this crucial report.
The Information Commissioner’s response to the appeal was initially due 9 April. I am encouraged that he has requested an additional month to seek counsel before responding to my request that try to “agree on what we agree on“.
There are 163 fully selective ‘grammar’ schools in England that admit pupils based on an entrance test commonly called the 11+. How many children sit these tests? How much does this all cost? Simple questions but finding the answers was remarkably challenging.
In Bexley, Gloucester, Kent, Medway, Redbridge, Warks & Wirral the local authority still manages the test. However, most grammar schools have converted to Academies. Only 5% are ‘maintained’. The rest are at liberty to set their own test. This enables them to manipulate the way the results are ‘standardised’ to ensure the wanted number of candidates pass, even if there is a notionally ‘fixed’ qualifying score. This Tribunal ruling records that when places were being left unfilled, the grammars, “decided to increase the number of candidates achieving the required score.” (At paragraph 6.6)
The local authority test remains part of the admissions process for 60 schools although over half of these are in Kent. 30 schools have ‘standalone’ tests, unique to the individual school. The rest join forces with nearby schools to set a common test. However, that seems aimed more at reducing ‘test tourism‘, which grammars complain ‘drains their coffers’, rather than maintaining fixed standards or making things easier for candidates. In 2024 there were 57 varieties of “the 11+”. How fitting!
Who is responsible?
The first challenge in finding any information about the 11+ is just knowing which authority to ask. The Lincolnshire Consortium of Grammar Schools’ website says its test covers the county’s 13 grammar schools. The accompanying map shows 16.
If the consortium doesn’t know how many schools it contains, what hope for the rest of us? (Correct answer is neither 13 nor 16 but 15. King Edward VI in Spilsby, marked with a 6 in this screenshot, is non-selective. You heard it here first!)
Whatever structures are in place to deliver the test, the admission authorities are ultimately responsible. Most grammar schools are academy converters, so the school is its own admission authorities. There are some Multi-Academy Trusts which throws a bit more confusion into the mix but the approach was to start with the grammar schools themselves. In November 2024, Freedom of Information requests were submitted to all 163 fully selective schools asking about the 2024 testing relating to their specific school.
Diverse diversions
Some schools disclosed the total number of candidates sitting a consortium test combined with the cost to the individual school making it seem a fraction of the correct amount. Several schools applied an innovative interpretation to the question of their costs by replying there was no charge to applicants.
The most creative refusal award goes to the school that would not even disclose the number of candidates sitting the test because this would, “allow applicants to calculate the distribution curve of results [and] enable some applicants to deduce that they are guaranteed a place.” The school cited section 2.1 of the School Admissions Code, “admission authorities must not give any guarantees that a preference will be met.” That has to be the broadest interpretation of ‘guarantee’ ever!
It also directly conflicts with the position taken by the School Adjudicator relating to another public authority. Paragraph 56 starts, “The information provided to parents by the school is minimal: that children must reach the required standard in a set of tests, but with no explanation as to what these tests entail or what the required standard is. Parents are not able to look at the arrangements and easily understand how places are allocated …” Since the required ‘standard’ [sic] invariably fundamentally depends on how many other candidates are competing for places, the corollary is the Adjudicator’s position is this information should be proactively published by the school.
DIY 11+
With hindsight, asking how much was spent on external test providers was not ideal. Several schools write their own tests and were keen to claim this made them free of cost. This neglects the fact that compiling a test diverts teaching staff from other duties such as … erm … teaching!
Excluding valid exemptions, public authorities must disclose any information they hold. However, asking for a breakdown of the hours spent writing tests and value of staff time would probably be refused giving the ultimate excuse that the information is “not held”. Another way of costing home-brew tests was needed.
The average cost per candidate for commercial tests is about £25. Collectively, Kent, Bexley, and Buckinghamshire tested 34,519 candidates at an average cost of £21.59. Presumably their size allows them to negotiate a good rate per test. This conservative figure was used to calculate the cost of the DIY tests used by 22 schools.
“Commercially sensitive”
Whilst most grammar schools disclosed the cost of their tests, a few withheld this information claiming it was commercially sensitive. Rather than refer each to the Information Commissioner, he was asked to consider one test case. His decision notice explains the commercial prejudice exemption is, “designed to protect genuinely confidential and commercially sensitive information … not a blanket approach to non-disclosure.” Am glad that’s clear now.
Following that decision, rather than challenging the original refusals, fresh requests were made for any withheld costs. The Lincs Consortium deserve a special mention here. A month after the Information Commissioner issued his decision notice I was told they needed to clarify ‘what format’ to use to disclose costs. (Perhaps they paid using Russian bitcoin and wanted to know if they could reply in Cyrillic?) Having failed twice to get the costs from the Consortium, a third attempt was made by directly asking each of the 15 member schools.
The results!
After eight months, over 200 FoI requests, the Information Commissioner getting involved, and some truly spectacular dragging of heels the final figures are … suspenseful drum roll … in 2024 England’s ten-year-olds sat 123,601 11+ tests at a cost of £3,070,734. However, there are a couple of caveats.
Firstly, the requests were only for the cost of the test. Tenders on the gov.uk website show admin can often add 80% to the cost. After a slow start, Kent Council very helpfully disclosed both the cost of the test (£223k) and its administration (£220k). Their admin costs almost double the cost. The total cost is more like £5.5 million.
Secondly, these are the number of tests and not candidates. Schools Week reported that parents enter their children in neighbouring 11+ tests to provide free practice. This gives us an upper limit of the number of individual children taking one or more 11+ tests but, because the test is unregulated, it is impossible to get an exact figure.
There are a few more interesting findings in the following sections.
Sutton
Just five grammar schools in Sutton account for 11% of the total number of tests. Once again, this isn’t quite as straightforward as it might seem. Schools in Sutton don’t do things by halves. 9,340 aspiring applicants first took the Sutton Entrance Test (SET) written by Sutton grammar. Of those, 1,167 girls took the second stage test for Nonsuch and Wallington Girls. 1,230 boys took the second stage test for Wilsons, Wallington (Boys) and Sutton.
An investigation by Comprehensive Future and Schools Week found a ‘money spinning racket’ of arms’ length companies running mock tests to raise funds for the schools. Parents need to stump up £95 per child to enter both mock tests advertised on Wallington School’s website. This explains, “Wallington County Grammar School will be used only as a venue for the tests. The staff of the School are not involved in the writing or marking of papers and are not used for invigilation purposes.” This raises more questions than it answers. Who does write and mark these papers? How much do Wallington pay them? Perhaps the income from selling mock tests is donated to schools quid pro quo to compensate for the preparation time so the test can be described as “free” when in reality parents are funding it via mock testing.
Sutton grammar schools have a monopoly on the Sutton Entrance Test. The clue is in the name. If just half the parents of the 9,340 applicants taking the first stage test paid £95 to give their children the privilege of a sporting chance this would raise £887,300 each year.
Kent
Kent County Council claim their test identifies the top 25% of the ability range calibrated according to national norms. That claim has been bugging me for some time. It’s not possible to simply validate by looking at the pass rate because the children entered into any 11+ test are always a self-selecting cohort. The council website says 4,792 Kent children passed the 2024 test. DfE data shows there were 19,135 Y6 children in Kent last year. Together, this information tells us that 25.04311% of the county children passed the test. It seems the Kent test is calibrated (empirically) according to county norms, although that is unlikely differ materially from national norms.
The irony here is that Kent refused to disclose how many sat their test, even though, they’d published this on their website a month earlier. Force of habit I guess. In doing so, they also withheld information which would enable me to check their “25% ability” claim. I only managed this because someone tipped me off that the “withheld” information was fully in the public domain.
The 2024 Kent test assessed 16,446 children. for entry into one of the county’s 32 grammar schools. The test cost £223,169.87 with administration adding another £220,979.62. That’s just short of half a million quid each year. This tops all the charts but also begs the question why seven schools in Kent (Borden Grammar School, Dover Grammar School for Boys, Dover Grammar School for Girls, Highsted Grammar School, Mayfield Grammar School, Gravesend, The Folkestone School for Girls, The Harvey Grammar School) consider it necessary to lay on an additional 2,246 tests at a cost of £71,845. (Plus about the same for admin.)
In 2005 Kent County Council complained about this to the School Adjudicator. The council argued this would, “have the effect of inflating the total numbers who pass beyond the 25%.” The adjudicator questioned, “the educational wisdom of requiring 10 and 11 year olds to undertake a multiplicity of separate tests for, essentially, the same purpose.”
Problem: Not enough children pass the county test because it is properly calibrated to pass ¼ of children.
Solution: Introduce a second lot of tests.
If these schools found insufficient numbers of children passed the Kent test for them to remain full they could have changed the qualifying mark (after public consultation.) That would have been easier for parents and children. It would have been less expensive. It would also have been an honest, open and transparent way to make the changes.
North Yorkshire
Ripon Grammar School is one of the 5% grammar schools that are still local authority maintained. This means the school is not responsible for admissions or the test. They could have just redirected me to North Yorkshire Council, but I am very grateful that they obtained the information on my behalf. 247 candidates took the ‘North Yorks’ test in 2024. This cost £37,400.
This cost per head is about six times the normal going rate. North Yorks Council is under no obligation to disclose why it pays so much for the test and I didn’t ask. However, there may be a clue on its website. Previously, the council’s test covered all three North Yorkshire grammars. The website now categorically states they are only responsible for the Ripon Grammar School. Queries about the Ermysted and Skipton test are redirected to those schools’ websites. It could be that the council is unable to extricate itself from a fixed price/term contract to provide tests for all three of the county’s grammar schools. If so, this demonstrates the waste and duplication that comes from having a deregulated education system that allows schools to introduce their own admissions tests whenever they think this can give them any advantages.
Cost per candidate
(As per above) there are 57 different “The 11+”s ranging in size from single “standalone” schools testing 250 candidates to Kent County Council’s gargantuan grilling of 16,446 children for entry into 32 grammar schools (seven of which also do their own thing!)
A good way to explore the relative costs is to plot the total cost by the number of tests. Given the range in size, tests have been divided into two groups. The first plot includes local authority and consortia as well as single schools that test more than 1,250 candidates. (The graphs are best viewed on a device with a proper screen!)
The red-orange markers are schools with DIY tests. The numbers of tests are known but not the true costs which the schools claim is ‘free’. These have been assigned the conservative cost of £21.59 per test so all appear on a straight line.
The blue markers are more informative. For example, they show that Medway council (top left) is paying far more per test than Kent (rightmost and towards the top.) Medway were not asked to include the cost of administration, but even if they had, they seem to be paying over the odds for their testing.
The range of the axes on this plot are about a tenth of the ‘consortium’ plot above. Future Stories (green) appear to charge per school rather than per candidate. The blue point at the top left is Ripon grammar. North Yorks Council paid £37,400 for 247 test – way above the (imaginary) trend line running from bottom left to top right.
Money for old rope?
The 11+ usually consists multiple choice testing of four topics: Verbal Reasoning, Non-verbal reasoning, Maths and Comprehension. In keeping with the 57 Varieties moniker, there is no consistency over which topics are included or what weight each is given. Tests are collated from ‘banks’ of questions. Multiple choice questioning avoids the expense of hiring real people to mark test scripts. Printing costs and optical scanning of answer sheets are relatively low. The main expense is in creating the question items.
The first 11+ test was created by the National Foundation for Education and Research (NFER) in 1947 (Sutherland 1990). NFER set up nferNelson to make their tests commercially available. The intellectual property created by NFER was transferred to Granada Learning Assessment (GLA) in 2000. GLA has a virtual monopoly on providing commercial tests. Whilst GLA may have created new individual test items, the practice material they publish has not changed since 2000. This ‘copy and paste’ method of churning out tests becomes very obvious when mistakes are made.
This raises questions about how often test items are reused, how much content in each test recycled, and how much ‘new’ material really is novel rather than the same old questions is a slightly different format. Are GLA excessively profiting from the intellectual property they acquired from NFER? What is their profit as a proportion of income? GLA is a private company so if they were abusing their monopoly they are under no obligation to disclose any information which would reveal that. The 11+ is the only high-stakes test not regulated by Ofqual but perhaps someone from the DfE could question whether it is good use of public funds to support 57 Varieties of 11+?
Errata
Schools were not asked to disclose their test provider but many volunteered this so it was included in the plots. A few of Kent schools that provide a second test use CEM so classifying this group as GLA isn’t correct. Checking this would involve further FOI requests to the schools. Five schools use tests provided by Future Stories. This doesn’t change the fact that GLA have a virtual monopoly on commercial tests.
As of 07/07/2025, the numbers of tests taken in 2024 was complete. The costs from a few schools are still outstanding. The (conservative) figure of £21.59 per candidate was used to calculate the totals. This article may be updated as final results trickle in but these are not expected to make any significant differences to overall figures.
References
School Adjudicator’s Decision (July 2005) Case reference: ADA/000723, Objector: Kent County Council, Admission Authority: The Governors of Folkestone School for Girls.
Sutherland, A. E. (1990). Selection in Northern Ireland: from 1947 Act to 1989 Order. Research Papers in Education, 5(1), 29–48. https://doi.org/10.1080/0267152900050103
Freedom of Information requests were all submitted via the WhatDoTheyKnow website. When multiple requests are submitted using the same title, this appends a number to the URL.
I was recently asked to help with Comprehensive Future’s Fair Admissions Advisor. This provides general guidance on what effect different admissions policies have on school inclusivity. It also specifically reports on the socioeconomic profile of any secondary school compared to its surrounding area. Large Language Models are notorious for casually inventing ‘facts’ then confidently and articulately presenting these as the truth. My task was to ensure the data behind the Admissions Advisor provided an objective way to compare individual schools to the surrounding local area based on factual evidence.
The initial ask was to match each of England’s 3,000 odd secondary schools to its nearest primary school and extract the proportion of children receiving Free School Meals (FSM) at each. FSM is commonly used as a proxy for socio-economic profile of school cohorts. However, just looking at the single nearest primary school would inevitably lead to some odd results. Based on some ideas I had from 2019, I suggested we look at several nearby primary schools weighted according to their cohort size and the square of their distance. This gives a simple model for the relative ‘influence’ of each neighbouring primary school:
The reason ‘influence’ diminishes by the square of distance is because, even if it isn’t formally defined, the effective catchment area of a school increases by the square of its radius. This is known as an inverse square law. It crops up wherever the ‘intensity’ of something spreads out over distance such as gravity, sound propagation, or even the wave energy from a stone dropped in a pond.
How it works
Here’s a simple example. It’s based on real data but, to keep it simple, only looks at the three nearest primary schools shown on the map at the top of the article. The first step is to obtain the Size – ie number of pupils, %FSM, and Distance for the primary schools nearest to the secondary school we’re looking at. These values are shown in the first three rows of this table.
School A
School B
School C
(row sums)
#1
Size
661
433
211
#2
FSM
8.60%
21.70%
18.00%
#3
Dist(km)
1.521
1.628
0.931
#4
Size/dist^2
285.72
163.37
243.44
692.53
#5
weight
41.26%
23.59%
35.15%
100.00%
#6
wght×FSM
3.55%
5.12%
6.33%
14.99%
The remaining rows show how the final ‘local area’ FSM rate is calculated:
#4: This row works out the relative weighting for each primary school based on its size divided the square of distance (). These relative values can’t be used directly so the first step is to add them up (692).
#5 This row takes each individual weight from row #4 and divides it by the total from the row above (692). The individual weights in this row now add up to 100%. In this example, roughly 40% of the weight goes to School A, 25% to B and 35% to C.
#6 The final step is to take each weight from row 5 and multiply by the primary school’s individual %FSM from row 2. These values are then added to provide the overall ‘local area %FSM’ of 14.99%.
Although primary school C is the closest, A is over three times bigger, so its weighting is the highest. Primary A also has the lowest rates of FSM by a large margin. This brings down the final ‘local area’ FSM to just under 15%. A simple (unweighted) average would put too much emphasis on B & C’s higher FSM figures.
This example also demonstrates the problem of not checking enough local primary schools. Getting this right involves some ‘tuning’. The final version checks the 18 nearest primaries and ‘local FSM’ for this this example (Cornwallis Academy) ends up a lot higher at 25.2%. The school admits 30.6% FSM children so there is a ‘positive gap’ of 5.4%. If only three primaries were checked the gap would appear much bigger.
How many primaries to check?
It is essential to check enough neighbouring primary schools to get a representative view of ‘local FSM’ but beyond a certain point adding more makes no difference. One approach would be an ‘adaptive’ algorithm that keeps adding another primary school to the check list until the overall result becomes stable. The number of primaries checked would vary for each secondary school.
The approach used here is to set the number sufficiently high that it works for all secondary schools. This includes primary schools that don’t affect the outcome but by definition these doesn’t affect the outcome. Because distance is factored in, there is no maximum number to check, only a minimum. It is also easier to validate the process if the same number of primary schools are checked for every secondary school.
The target was set that the number of primaries checked should be high enough that the last of them accounted for a maximum 5% of the weighting for a minimum of 95% of the secondary schools. That sentence takes some decoding which can be better explained using this box plot.
How much each nth nearest primary school contributes to the overall “local area” measurement.
This shows the average ‘influence’ of each successively distant primary school on working out the ‘local area. FSM measure. The line in the middle of each box shows the median value. For example, the leftmost box means we can say that, on average the nearest single primary school accounts for about 0.2 or 1/5 of the measure.
The ‘whiskers’ have been set to show the 5th and 95th percentiles. The horizontal red line is at 5%. To meet the target the rightmost box including its upper ‘whisker’ must be wholly underneath the red line. This shows that for 95% of secondary schools the 18th nearest primary accounts for less than 5% of the weighting.
It takes some time to calculate all the results before they can be checked and enhancements to the initial algorithm (described below) meant increasing the number of primary schools checked. The final data and the plot above were both based on checking the 18 nearest primary schools to each of the 3000+ English secondary schools. The plot shows that the last three are fully below the red line so this number could have been reduced but there is no real benefit.
The results
Research by the Sutton Trust found, “80% of parents believe state schools should have a mix of pupils from different backgrounds. 76% say that intakes should reflect the make-up of the local community, and 69% say high achieving schools should make an effort to take in pupils from less well-off backgrounds.” (Cullinane 2020).
This method provides an objective quantifiable measure of whether a specific secondary school’s intake reflects its local community. Individual schools can be plotted on a graph like this.
Gap between Kent schools and their local communities. Open full screen.
This shows just the secondary schools in Kent (about 100 of them). Hovering over each point brings up the school its details. Those above and to the left of the line admit relatively more deprived pupils than the local community. Those to the bottom right admit fewer. The schools have also been categorised as either Comprehensive, Faith, or Selective. Clicking on the legend for each can remove and add them from the graph.
Other generalisations can be made by looking at all 3,070 secondary schools:
341 single sex schools on average admit 7.15% fewer disadvantaged children compared to the local area. The 2,729 mixed sex schools on average admit 0.75% more disadvantaged children.
163 selective (grammar) schools admit 17.4% fewer disadvantaged children. 533 faith schools admit 2.7% fewer disadvantaged children. The remaining 2,374 secular comprehensive schools admit 1.64% more disadvantaged children compared to their local area.
A closer look at faith schools
Although overall faith schools admit 2.7% fewer disadvantaged children, there is a lot of variation between different faiths. The following table breaks down all of the 533 schools which the DfE have recorded a ReligiousCharacter value against. These values don’t always make sense. For example there are 7 secondary schools categorised as Church of England/Roman Catholic. It seems almost as if whoever entered the data wasn’t too sure which of the two was correct so hedged their bets! No attempt has been made to rationalise the DfE’s categorisations, for example by adding the one “Anglican/Church of England” school to the other CoEs or visiting the websites of schools to check.
The following table shows ReligiousCharacter, Gap size and number of schools in each category. A “negative gap” indicates the schools admit more disadvantaged children compared to the local area. The rows can be sorted by clicking on the headings.
ReligiousCharacter
Gap
#Schools
Roman Catholic
4.09
289
Church of England
0.83
170
Christian
3.37
41
Muslim
5.59
18
Jewish
14.28
14
Church of England/Roman Catholic
0.70
7
Roman Catholic/Church of England
-1.26
5
Catholic
4.87
3
Sikh
16.45
2
Anglican/Church of England
-12.50
1
Church of England/Christian
-1.10
1
Greek Orthodox
-2.50
1
Hindu
10.20
1
Categorising ‘inclusivity’
As part of the requirements to make it easy to understand, the Fair Admissions Advisor presents a categorical interpretation of gap sizes in plain English. After calculating the gap for each school, the 10th, 25th, 75th and 90th percentiles were found. Schools were then classified into one of these five ordinal descriptive categories.
Measure
Description
Below 10% quantile
very inclusive
Between 10% and 25% quantiles
more inclusive than most
Between 25% and 75% quantiles
broadly typical
Between 75% and 90% quantiles
less inclusive than most
Above 90% quantile.
among the least inclusive
This plot shows the distribution of all 3,070 secondary schools’ ‘gaps’.
This shows at a glance that the ‘nearest primaries local FSM’ method doesn’t need much calibration ‘out of the box’. The proportion of FSM children in schools should match the proportion in the community. The median gap for all schools should be zero. This would mean the two yellow areas are equal in area. The uncalibrated median gap size is -1.03%. If the y-axis of the above plot was moved down by 1% the two halves of the plot would balance around zero. The final results are adjusted by this amount.
League tables!
This table shows the ten schools with the highest gaps between the proportion of disadvantaged children they admit and those attending local primary schools.
School
School FSM
Local FSM
Gap
Birmingham Ormiston Academy
13.7
57.4
43.7
The Queen Elizabeth’s High School, Gainsborough
8.7
49.6
40.9
King Edward VI Five Ways School
17.3
55.3
38
St Anselm’s College
11.4
46.9
35.5
The Blue Coat CofE School
11.8
46.4
34.6
Skegness Grammar School
22
56.3
34.3
Dover Grammar School for Boys
17.4
50.2
32.8
King Edward VI Handsworth Grammar School for Boys
14.3
46.2
31.9
The North Halifax Grammar School
5.1
36.8
31.7
Beis Yaakov High School
2
33.6
31.6
Improvements
This article was initially written in March 2025 to describe the basic approach of using local primary schools weighted by size over the square of their distance to work out the “local area FSM”. It has been updated a few times since to reflect enhancements to this method.
Income Deprivation Affecting Children Index (IDACI)
Before March had finished, the code had already been modified to compare schools against Income Deprivation Affecting Children Index (IDACI) Score using an inverse square weighting to distance.
This involves about a billion distance calculations and takes about three hours to run but has some advantages. IDACI is a direct measure of deprivation so offers a better method for education researchers. Because primary schools aren’t being used as the ‘yardstick’ their inclusivity can also be checked. These two plots compare the IDACI based measures against the ‘nearest primary’ method for secondary schools with different tuning parameters.
The plot on the left adds a fixed one metre to the calculated distances to nearest primary schools. The one on the right adds 1,000 metres (1km). The values here are closer to the trend line indicating a better match to the IDACI based measure of ‘local area’ disadvantage.
There was a lot of discussion over whether the Fair Admissions Advisor should use the IDACI method instead of nearby primary schools which in turn may not reflect their local community. Analysis of travelling distances showed that children tend not to travel very far to attend primary schools and the above plots show a good correlation between the two methods, especially if a fixed 1km is added to the distance to each primary school.
The big disadvantage of the IDACI method is it is a different measure of child poverty compared to FSM. The Fair Admissions Advisor needed to be easy for ordinary people to understand. The public are familiar with FSM. Not so IDACI. To extend the usual metaphor, it’s better to compare apples with apples especially if the alternative (IDACI) is a kumquat which hardly anyone has heard of.
A bit less local?
When the initial ‘local area FSM’ figures were calculated some odd results were noticed. This is not uncommon when making statistical generalisations. There are often specific examples that that don’t fit. In this case, testing revealed that Astor School’s ‘local FSM’ rate was 45.1% whilst neighbouring Dover Boys was 53.5%.
It doesn’t make sense for the ‘local FSM’ rates for two adjacent secondary schools to differ by so much, but equally it doesn’t make sense to have two adjacent secondary schools! Plotting the neighbouring secondaries (green) and the nearest four primaries (red) on a map helps understand how this particular example came up and suggest how the ‘local FSM’ formula could be improved.
There are roughly five primary schools for each secondary school. If they were just located to serve populations we’d always expect to find some primaries between any pair of secondary schools. However, this is Kent where schools are located to serve segregation. Primary schools between the secondaries schools would normally provide a gradual transition between areas of different affluence but there are none between Astor and Dover Boys!
Another factor here is the rapid change in demographics over a very small area. St Martins has only 22.2% FSM whilst the other three have 50-60%. Because the formula uses straight line distance calculations it’s 50% further to Dover Boys. This would be less if a real world ‘by road’ distance was used but this is impractical. There are several very specific factors here that combine to create the unusual result. It would be wrong to change the model to address a specific set of circumstances, but this suggests that the initial model was a too ‘sensitive’ to relatively small changes in schools’ locations. The solution was to add a constant value to the distance to each primary school:
This ‘spreads the net a bit wider’ so it became necessary to increase the number of primary schools checked. This is a good sign. It shows that the results are not based on too few primaries. As per the box plot above, the single nearest primary accounts for a fifth of the measure on average. Both the number of primaries checked (p) and the distance constant (k) are configurable parameters in the code. With (1 kilometre) the difference in ‘local area’ FSM between these two schools drops to a very reasonable 1.5%.
How local should the local community be?
The Sutton Trust’s research concluded parents think schools’ admissions should reflect the ‘local community‘. However, local community is subjective. In this context it is based on how far children should travel to a school of choice. This becomes controversial because one parent’s desire that local community is broadly enough defined to enable them to apply to a particular popular school which has a finite number of spaces comes at the expense of another more local parent’s choice.
There is a minimum amount of effort involved in any journey to school even if the school is next door. It is not five times more effort to take the bus five stops than just one. For that reason, adding a fixed distance to each primary school makes logical sense. Where to set this is a matter of ideology. Thatcher’s 1980s neo liberalisation of state education provision created a parentocracy. In theory, parents are free to choose which schools they send their children to. In practice, this creates winners and losers and invariably those with the least social and economic capital end up losing.
Setting it to 1km reduced the difference in ‘local community’ FSM between Astor and Dover Boys to under 1.5%. That addresses the otherwise bizarre situation of having two schools next door with different ‘local area FSM’. It also reduced the weight given to just the nearest one primary from about 50% to 25% of the measure. Neoliberals would want to see this value increased. Those who consider local schools should be for local children would prefer it to be close to zero. The value is configurable. Just don’t expect agreement between these two opposing camps on where it should be set.
The Maths
The initial version of the ‘local area FSM‘ formula, as per the example based on just based on the three nearest primary schools, can be generalised for any number primary schools and formally expressed as:
Adding a constant to the distance is a very minor modification to the equation:
The IDACI formula is simpler. LSOAs are designed to contain similar population sizes so don’t need to be weighted.
Department for Education, Get Information About Schools data download page.
Department for Education, A guide to the single academy model funding agreement, [2013]. gov.uk website (pdf)
Fitz, J., Taylor, C., & Gorard, S. (2002). Local education authorities and the regulation of educational markets: four case studies. Research Papers in Education, 17(2), 125-146. https://doi.org/10.1080/02671520210122900
Earlier this month campaigners from Time’s Up For The Test (TUFTT) organised a session in Canterbury to discuss ending selection. Parents were surprised to discover children in other parts of the country don’t have to take a test to go to secondary school. Kent is very selective but is it the most selective?
The data.
We downloaded the latest data from the DfE website, plotted the total number of school places (light blue) then overlaid the number of grammar school places (dark blue) for each local authority.
Kent has the largest absolute number of children in grammar schools, 28,795 out of 93,480, just over 30%. That is puzzling because Kent County Council recently confirmed that their test identifies the top 25% of the ability range “calibrated according to national norms“. Buckinghamshire educates fewer grammar school pupils but a greater proportion of them. 11,814 grammar school places out of a total 33,278. That’s over 35%!
The data shows where children attend school, not where they live. Perhaps both counties provide excess grammar school places to become net importers of high prior attainers thereby boosting their raw GCSE league table results.
grammar school places by local authority
The Isles of Scilly appears to be missing but there are only 98 secondary school age children on the island – too few to show up on the graph. On average, about 20 per year. Sending them to different schools based on ability, sex and religion would be quite a challenge!
In 1964 Harold Wilson’s government announced the end of selection. However, the task of implementing this was given to Local Education Authorities (LEAs) via a circular. Government circulars set out principles and policies but have no legal effect. Like the pirate code they are, “more what you’d call guidelines than actual rules.”[1]
The following government under Ted Heath issued another advisory circular saying any decision to end selection lay with the duly elected local authority. Wilson was re-elected in 1974 and reiterated the objective of ending selection via another non-binding circular. That was given a statutory basis by the 1976 Education Act which said, “education is to be provided only in schools where the arrangements for the admission of pupils are not based (wholly or partly) on selection by reference to ability or aptitude.”[2] The 1976 Act was repealed three years later by Margaret Thatcher’s government.
David Blunkett told the 1995 Labour conference there would be no selection, either by examination or interview. Labour’s School Standards and Framework Act (SSFA) 1998 prohibits the creation of any new grammar schools. It also includes provision for local communities to remove existing selection. Several ballots have been attempted but none has ever succeeded.[3][4] The BBC reported concerns that the rules defining feeder schools were rigged in favour of maintaining the status quo. “… parents at private prep schools can vote, because the schools successfully prepare children for the 11-plus, while Catch-22 means that parents in nearby state primary schools are excluded because the schools have no tradition of sending pupils to grammar school.” [5] Blunkett later clarified that what he had intended to tell conference was no further selection!
Making 150 odd LEAs responsible for delivering a national comprehensive system resulted in a heterogenous shambles. Over three quarters of England’s LEAs do not have a single selective school. Others have just one or two. Nine LEAs were defined in the Education (Grammar School Ballots) Regulations 1998[6] as fully selective areas because at least 25% of children were educated in grammars. In Buckinghamshire and Trafford, that figure is closer to 40%. It is a chaotic mess which is neither selective nor comprehensive. It satisfies neither no-one in a bitter debate normally contended on anecdotal ideological grounds.
The problem facing politicians may stem from an inability to clearly distinguish between phasing out grammar schools, widely seen as providing a superior academic education, and phasing out selection which determines which children are admitted to those schools. No politician would ever argue for the abolition of (the fictious) St Crispin’s Grammar, founded in 1482 which always gets such good exam results.
Even DfE statisticians have fallen into this trap, perhaps pushed by ideological political masters. Their analysis of preferences recorded by parents applying for secondary school places concluded, “The first preference demand for grammar schools, relative to supply, is 49 per cent greater than for non-selective schools.” [7] The report appears objective, but it manifestly fails to address the question it superficially appears to deal with. Faced with a selective system, parents will still prefer the selective school which gets good results. The implication that they are therefore content with a system that forces them to coach their children from an early age is simply non-sequitur.
Social mobility?
The 1944 Education Act was intended to create a tripartite system offering an academic education through grammar schools or technical based schooling along with basic provisions for those children who were neither academic nor technically proficient. Existing grammars were rapidly assimilated into this system but very few technical schools were created. The result was a secondary education system focussed only on academic achievement which defined children at the outset as either successes or failures based on the 11+ test.
This gave rise to an entire industry of prep schools so named because their entire raison d’etre is to prepare children for grammar schools – ie pass the test. In the same way pilot fish owe their existence to sharks, prep schools would never have evolved without selective education. Paying to put children through prep-school is widely seen as a cost-effective way to get the state to pay for secondary education every bit as good as private schools. It is a good investment. Egan and Bunting (1991)[8] found intense coaching resulted in gains of 30 or 40 points in the context of a 100-point scale.
In Kent, which has more grammar schools (32) than any other authority, the council warned schools that such coaching was “not permitted” and that it would ban non-complying schools from hosting the test. That did nothing to prevent them from openly advertising how successful they are at coaching children to pass the test. One school was even admonished by the Advertising Standards Authority, not for openly ignoring the council’s ban on coaching, but for exaggerating how effective it was at doing so.[9]
Labour may have initially welcomed selection believing it would promote social mobility by offering a first-class education to any academically proficient child. However, repeated studies show grammar schools contain far fewer proportions of pupils from deprived backgrounds than other state-funded schools[10][11][12].
Faced with such uncomfortable facts, in 2013 Buckinghamshire announced they were introducing new “tutor-proof” tests[13]. It was claimed these tests could assess natural ability[14] and they rapidly gained popularity to the point where Theresa May said, “While there is no such thing as a tutor-proof test, many selective schools are already employing much smarter tests that assess the true potential of every child. So new grammars will be able to select in a fair and meritocratic way, not on the ability of parents to pay.”[15] However, this claim was based entirely on fantasy. The Commons Education Select Committee concluded that attempts at creating a ‘tutor-proof’ test had been unsuccessful and “… that efforts to make the examination less predictable may have the converse effect of encouraging well off parents to pay for more private tuition, further disadvantaging children from poorer backgrounds.”[16]
Far from promoting social cohesion, the evidence shows that grammar schools have the opposite effect leading to former head of Ofsted Sir Michael Wilshaw described them as “stuffed full of middle class kids.”[17]
Expansion by stealth.
Although Parliament outlawed the creation of any new grammar schools, government found creative ways to circumvent this. Changes to the Schools Admissions code in 2012 made it easier for schools to expand. In 2015, Education Secretary, Nicky Morgan, approved the Weald of Kent Grammar to create an ‘annexe’ 10 miles away in Sevenoaks. A decision which would not have been out of place in an episode of Yes Minister. In 2018 the Times reported, “Grammars paid 20 times more to expand than comprehensives”.[18] The article explains how the Condition Improvement Fund (CIF) supposedly intended for stopping roofs collapsing or boilers exploding had been used for school expansion. Half the expansion spending went to the handful of remaining grammar schools. Theresa May’s government announce £50m per year funding to expand grammar schools on the strict undertaking that they admit more disadvantaged children. Those benefits do not seem to have materialised.[19][20]
The underrepresentation of disadvantaged children in grammar schools is not contested. Addressing that was one of the key factors in the May government’s 2016 Green Paper. What is open to debate is whether the proposed policy would address it.[21] When challenged by Teacher Tapp’s self-confessed education evidence geek Karen Wespieser, Theresa May reportedly shut down the debate by saying, “You can have all the evidence in the world, but headteachers have told me grammar schools are good for disadvantaged pupils.”[22]
The reasoning behind this seemingly ideological fixation on just one type of school based on how it selects its pupils is not immediately obvious. However, viewed in the wider context of a decade of austerity and 9% real terms reduction in education funding[23] Jon Andrews from the Education Policy Institute suggests it is a promise of ‘jam tomorrow’.[24] It is easier to create more grammar school places and nebulously argue this will give poorer children better opportunities in the future by which time it is far too late to judge the efficacy of the policy. That is considerably easier than raising taxes to support a properly funded education system.
Parental choice?
“The world has been fundamentally reordered by widespread neoliberal economics that has privatized basic public goods – social protections, education, pensions and criminal justice among them – with often disastrous impacts on the human rights of the extremely poor.”[25]
The widespread acceptance of this maxim, that public services can only operate efficiently when there is an element of competition has arguably driven the biggest social upheaval since the second world war. Thatcher’s 1988 Great Education Reform Bill applied this ‘market based’ approach to education by making schools compete with one another for pupils and the funding they attract.
The problem is that, unlike grocery shopping, parents can’t just switch to a different school this week if last week’s trigonometry was a bit off, like the cabbages on aisle 13. Parental choice is a myth. Schools choose pupils. In 1988, when Thatcher’ bill was passed, 15% of schools acted as their own admissions authority. A decade later that had doubled to 30%[26]. The Academy program stripped away any vestige of accountability. 95% of secondary schools now determine their own admissions.
The other major flaw in this policy is as Goodhart’s law observes, “When a measure becomes a target, it ceases to be a good measure”. Year after year, national media publish articles praising the “top 100 state schools” based on raw GCSE results. Fiona Millar wrote about the bewildering complexity of admissions and how different criteria were used and abused.[27] Millar observed that, “the pressure of the performance tables has led to some schools finding ingenious ways of using their freedoms to improve intakes.” In the case of academic selection, the school does not even need to be ingenious. Unsurprisingly, research shows that by far the strongest predictor of attainment at age 16 is attainment at age 11. “This seems to confuse some commentators, members of the public and even policy-makers who assume that the good results are largely due to what happens in the school rather than the nature of the children selected.” [28]
Children need to learn critical thinking skills, how to collaborate, derivative subsumption, creativity and far more proficiencies that exams don’t even touch. Sociologist William Bruce Cameron nailed it, “Not everything that can be counted counts. Not everything that counts can be counted.”[29] Our market-based education system is divisive. It pits schools against each other to create winners and losers. It is informed by lazy journalists incapable of looking beyond raw GCSE results which predominantly test knowledge acquisition in an age where this is available at the click of a mouse. Grammar schools are “good” because they select the right sort of pupils.
Ending selection
“As a result of the academies policy, a transparent national system of maintained schools, where schools operated to a single legal model (with modest variations), had their own legal identity and management, and were overseen by democratically elected local authorities, has been transformed into a highly opaque part-locally administered system and a part-centrally controlled system of academies.”[30]
Sixty years of political football between the two main political parties has resulted in an education system which is neither selective nor comprehensive. On top of that academisation has systematically removed any accountability replacing this with an anarchic system in which schools compete with one another for limited resources like the dystopian Hunger Games but less lethal.
The first step to reforming this Kafkaesque monstrosity must be removing control of admissions from the schools. Even die-hard Thatcherites must see the fundamental flaw in that. Regional independent admissions authorities need to be created that can take a holistic view about what is best for the area rather than individual schools gaming the system to their own advantage. These admission authorities need to be overseen by democratically elected bodies. Sounds familiar?
Renationalising academies will remove ‘top slicing’ which currently diverts public spending away from educating children. Six of the largest LEAs, responsible for educating nearly half a million children each had just one person being paid over £130,000 (director of children’s services.) The largest 19 Multi-Academy Trusts also responsible for educating the same number of children apparently need 106 executives paid over £130,000.[31]
Once accountability for admissions has been restored, the government will be able to finally deliver Blunkett’s promise from 1995. “Read my lips: no selection, either by examination or interview …”
Footnote
This article was commissed by a publication … which went bust after writing it. The brief was 2,500 words on ending selection but given how long that has been dragging on never ending selection seemed more apt. The article wa exactly 2,500 words without this footnote about 1/5 of which is citations, 🙂
[1] Barbossa H. The Curse of the Black Pearl, 2003.
[10] Atkinson, Gregg and McConnell. The result of 11 plus selection; An Investigation into Equity and Efficiency of Outcome for Pupils in Selective LEAs (2004)
[11] Cribb et al. Poor Grammar. Entry into Grammar Schools for disadvantaged pupils in England (2013)
[12] Andrews, Hutchison, Johnes, Grammar schools and social mobility (2016)
[25] United Nations. World Altered by ‘Neoliberal’ Outsourcing of Public Services to Private Sector, Third Committee Experts Stress, amid Calls for Better Rights Protection. October 2018, https://press.un.org/en/2018/gashc4239.doc.htm
[26] West A & Hind A 2003, Secondary school admissions in England: Exploring the extent of overt and covert selection, Centre for Educational Research Department of Social Policy London School of Economics and Political Science
[28] Gorard, S. and Siddiqui, N. (2018) Grammar schools in England: a new analysis of social segregation and academic outcomes, British journal of sociology of education. https://doi.org/10.1080/01425692.2018.1443432
[29] Cameron W. Informal Sociology: A Casual Introduction to Sociological Thinking, 1963 Random House, New York.
[30] West, A. and Wolfe, D. (2019) ‘Academies, autonomy, equality and democratic accountability: Reforming the fragmented publicly funded school system in England’. London Review of Education, 17 (1): 70–86. DOI https://doi.org/10.18546/LRE.17.1.06
[31] Campaign for State Education. Class divide. Private Eye, May 2023.
In February 2022 the First Tier Tribunal (FTT) ruled that the Buckinghamshire Grammar Schools (TBGS) did not need to disclose the reliability of its 11+ tests provided by Granada Learning Assessment (GLA). Last week the Upper Tribunal granted me permission to appeal that decision.
The background
In 2019 the BBC reported that the Verbal Reasoning (VR) section of the Bucks 11+ contained “impossible-to-answer” questions. TBGS and GLA agreed a solution involving removing eight questions from the test.
Parents were concerned about the impact this had on the reliability of the test. TBGS wrote to parents saying, “Detailed statistical analysis has been carried out and the solution proposed to and accepted by TBGS is robust. TBGS is confident that the issue has been resolved in a fair manner for all children and that the results for testing are robust. This outcome has been verified by an independent statistician.”GLA also told parents reliability had not been impacted. One group of parents described the notifications provided by TBGS and GLA as, “… a deliberate act of misdirection.”
The original hearing
I asked TBGS to disclose the analysis they based their decision making on. They refused. This led to the appeal. TBGS told the court that even the number of questions in the test was a “Trade Secret”. They said tutors could use this information to reverse engineer the reliability of the test and use this information to gain unfair advantages for their clients. I argued the reason they didn’t want to disclose the reliability of the test was they didn’t want to disclose the reliability of the test.
The Upper Tribunal’s decision
This week’s ruling says, “it was arguably inadequate for the FTT decision simply to state that it accepted the evidence of TBGS on a matter of which they did not have first-hand knowledge (as tutors) or objective expertise”. Upper Tribunal Judge Citron specifically questioned whether the lower court should have taken at face value witness evidence that disclosure of the number of questions in the test and its reliability would benefit private tutors.
I am profoundly indebted to David Lawson, chair of the Education Law Society for representing me pro-bono. Although the Tribunal system is theoretically open to unrepresented appellants, his involvement was essential in persuading the Upper Tribunal to reverse its earlier decision and grant permission to appeal.
Fun fact
The First Tier Tribunal judge who heard this appeal was the same one whose decision I successfully challenged in 2019.
Sir Graham Brady recently argued the case for expanding grammar schools in Schools Week which reported:
This makes two factual claims
The number of grammar schools has reduced.
Grammars are less inclusive due to population growth in existing selective areas.
Brady’s claims are put to the test here with three graphs.
Fewer grammar schools?
The School Standards and Framework Act 1998 prevents the creation of new grammar schools. After its introduction, the number of grammar schools remained fixed at 164 until 2013 when Ofsted inadequate Chatham Boys merged with Clarendon Girls. Both schools had operated as single school on two sites in Ramsgate since 2009. Following the merger, for purely administrative purposes the National Pupil Database now only records 163 grammar schools, but the last time any existing school stopped being selective was in 1998 when, following a campaign by parents and teachers, Bristol converted its two remaining grammars to comprehensives.
‘Selective areas’.
Nine local education authorities (LEAs) were defined in Schedule 1 of the Education (Grammar School Ballots) Regulations 1998 as selective areas. Since then, Wirral and Sutton have increased proportions of grammar school children beyond 25%. These two LEAs have been added to the original list and proportions of grammar school children in each plotted over time:
Figure 1: Proportions of grammar school places in fully selective LEAs (as percentage)
The proportion of children attending grammars in Bucks and Trafford has tailed off but still remains well over a third (36.8% and 36.5% respectively). Critics argue that even removing the top 25% by ability is damaging to neighbouring secondary modern schools. By 2022, 30.22% of children in the 11 selective areas were attending grammar schools.
Grammars ‘forced to become more selective’?
Brady states growth in population has forced grammars to become more selective. Since 2013/14, pupil numbers have grown by 13.43%. However, over the same period the number of children attending grammars in selective areas increased even further, by 14.91%.
Figure 2: Numbers of children in grammars in selective areas and overall school age population.
Possible explanations
Creation of new grammar schools is prohibited by primary legislation, so how did this happen? In 2018 Schools Week reported that the government had been funding grammar school expansion “through the back door” using the Condition Improvement Fund (CIF). 40% of secondary school recipients were grammars, even though they only make up 5% of schools.
In 2018 the government set up the Selective Schools Expansion Fund (SSEF). This set aside £50m/year to expand grammar schools in return for strict undertakings they become more inclusive. Schools minister Nick Gibb, confirmed grammars would no longer be able use CIF to increase pupil numbers. This made the process less opaque, but years after these grants were awarded the DfE still refuses to publish full details of public funding of grammar school expansion.
Since 2014 grammar school expansion has outstripped growth in pupil numbers by about 11%, but what about inclusivity?
Inclusivity
Brady says demographic changes have forced grammars to become less inclusive. In 2013, Cribb et al examined grammars’ inclusivity and found, “Less than three per cent of all pupils going to grammar schools are entitled to free school meals, against an average of 18% in other schools in the areas where they are located.” Chairman of the Sutton Trust which sponsored this research, Sir Peter Lampl, provided a foreword concluding, “… opening up grammar schools would transform social mobility …” This graph shows grammars’ subsequent track record on inclusivity.
Figure 3 – Proportion of children on Free School Meals in grammars, selective areas and nationally.
The proportion of disadvantaged children admitted to grammars remained level at around 2.7% until 2018. Since then, it has grown to 5.8%. However, this merely reflects the wider increase in child poverty.
Is inequality underestimated?
In comparing grammars against other schools in the areas where they are located Cribb et al may have inadvertently underestimated the degree of inequality. Andrews et al (2016) found parents are prepared to send their children twice as far to grammar schools. It follows that selective areas experience net inward ‘migration’ of affluent children making a comparison of just those children educated within each LEA unrepresentative.
Grammars’ inclusivity should be compared against national figures. Almost a decade after Cribb et al highlighted this issue, grammars still only admit 5.8% disadvantaged pupils compared against 22.9% nationally. The Sutton Trust may argue that grammars promote social mobility, but that is of little benefit if disadvantaged children are four times less likely to be admitted in the first place.
The need for honesty
The Prime Minister has instructed her ministers to draw up plans to reintroduce grammar schools. She has given Kelly Tolhurst responsibilities which include “standards and selection” as well as “disadvantaged and vulnerable children”. That will be a difficult circle to square!
Arguments about whether selection improves social mobility are covered well elsewhere. But if the government intend to retrospectively legitimise an already established policy of grammar school expansion through primary legislation, it is essential they are honest about the facts and robustly challenged when they are not.
Someone recently drew my attention to an article accusing Kent County Council’s 11-plus test provider of “age discrimination” in the way they calculated age weighting.
Part of the issue is grammar schools refuse to be open and transparent about how raw 11-marks are converted into the “standardised” scores used for admissions. There are two parts to this; age weighting and “standardisation“. The driving reason for the secrecy seems to be so they can modify the number of children passing the test whilst outwardly appearing to maintain a consistent qualifying score. The Guardian found that over five years, grammars increased their intake by 5.4% even though numbers taking the test only grew by 2.4%. The lack of transparency in the way 11-plus tests are processed is truly reprehensible, but is there any truth in the “age discrimination” claim?
Age Weighting
Children normally take the test when they are 10 years old. The difference in age between the youngest and oldest can amount to 10% of their entire life. Unsurprisingly, there is a small but statistically significant improvement in children’s scores as they get older. Age weighting simply measures this then adjusts for it.
To objectively evaluate “age discrimination” in the 2020 Kent test we need to compare the pass rates for each month. Fortunately, the original data is available here. This has been extended to calculate pass rates per month. These data were then plotted and a trend line added. The final spreadsheet is available here.
The 2020 trendline is almost perfectly horizontal. There is absolutely no evidence of “age discrimination”. There is some variation, but this is real data. The overall pass rate is 33.36%. That might seem high for a test intended to select the top 25%, however the Kent test is ‘opt in’. Those sitting it are self-selecting and should demonstrate a higher attainment than the overall population.
The blog author aggregates the data to quarters, reducing it from 12 samples to four. He then selects two he claims demonstrate “age discrimination”. Throwing away data is generally a bad thing. In this case it’s a moot point given his figures range from 16.2% to 19.2% – about half the true values – and bear no discernible relationship to the data they are purported to come from.
Cherry picking data out of context can be used to argue the exact opposite – that September born children were prejudiced against. Their pass rate is about 2σ below the mean. The probability of that happening by chance is 3.4% but this is real data. It did happen. In 2020. Age weighting is not there to ensure a nice spread of birthday parties across the full calendar year (although it does tend to have that effect).
Standardisation
The other part of the overall process is referred to as “standardisation”, although that is often taking an awful liberty with the language. By convention, test providers scale the results so they have a mean of 100 and standard deviation of 15 resulting in this distribution:
A lot of 11-plus tests do follow this convention, but in 2018 TES exposed Bucks grammars trying to conceal “alternative standardisations”. Evidence submitted in court shows Bucks used parameters which were anything but standard!
One way to visualise what’s going on with these numbers is to imagine the x-axis on the bell curve above written on a piece of rubber which can be stretched, shrunk and in 2018 was completely shifted sideways. Outwardly, the Bucks grammars maintained a “fixed” qualifying score of 121. Behind the scenes they changed the parameters to gerrymander their admissions numbers.
I’ve been threatened with a Strategic Lawsuit Against Public Participation (SLAPP) for merely explaining age-weighting using data disclosed by the responsible public authority. Volunteers at whatdotheyknow.com were similarly threatened. If grammar schools were open and transparent about this process we wouldn’t have nutty conspiracy theories such as this “age discrimination” one filling the void they have created in public understanding.
Every Autumn an estimated up to one in four of England’s ten-year-olds sits a test which determines their education for the following half dozen or more years. Every Autumn parents ask about reliability. It’s not an easy question to answer and information is hard to find. This article sets out to demystify what reliability actually means, and how the tests themselves are measured. A good starting point is the International Test Commission’s guidance which says:
Tests should be supported by evidence of reliability and validity for their intended purpose. Evidence should be provided to support the inferences that may be drawn from the scores on the test. This evidence should be accessible to the test user and available for independent scrutiny and evaluation. Where important evidence is contained in technical reports that are difficult to access, fully referenced synopses should be provided by the test distributor.
11+ provider GLA publish two metrics for its Verbal Reasoning test; internal consistency and re-test reliability. Both are calculated using well-established statistical methods. Both provide a value ranging between zero and one, where zero is about as useful as reading tea leaves and one is perfection. GLA’s VR test’s internal consistency is 0.97 whilst its test/retest reliability is 0.81, but without some additional explanation, those numbers don’t mean anything to the children whose futures are depend on the tests or their parents.
Internal consistency
Internal consistency is a measure of how much individual questions relate to each other. If a test consists of just synonyms and antonyms, there will be a strong correlation between how well individuals answer each question and how they perform overall.
Wiliam (2001) explains, There are only two effective ways of increasing the reliability of a test: make the scope of the test narrower, so you ask more questions on the same topic, or, what amounts to the same thing, make the test longer.
There is a limit to what can be expected of a ten-year-old from two hours of multiple-choice questions. To maintain a reasonable level of reliability, test providers make the scope of the test narrower. As Vernon (1957) eloquently observed, the 11+, “unfits pupils for sounder methods of study and deadens their initiative”. To give an extreme example, if every question in the test was identical, internal consistency would be almost 1.00. (In a large sample, calculated to enough precision, there will always be some variation in responses making the actual value slightly less than one.)
If you were to drop in a question on Renaissance art or nuclear physics, internal consistency would plummet, but a high value here doesn’t relate to what any normal person would define as reliability. 11+ tests always have high internal consistency. One grammar school FAQ claimed 11+ reliabilty is ‘well above 0.80’ compared to English GCSE scoring only 0.52, but did not explain what measure had been used. Internal consistency merely reflects the narrowness of the subject matter being assessed.
Test/retest
This measures what most people would normally consider ‘reliability’ to mean. It is calculated by testing an individual multiple times and comparing the results. GLA’s figure of 0.81 was based on 75 questions. Prof Becky Allen used data disclosed by North Yorks Council to calculate reliablility for an 80-question VR test as 0.89 (2017). Even after accounting for different numbers of questions, those two measures don’t quite tally, but that’s because they’re based on real data. Verbal Reasoning normally makes up 50% of the overall 11+. Combining GLA and Allen’s results, a reasonable estimate for the assessment’s overall reliability might be around 0.90.
Is 90% reliability “reliable”?
One way to approach that question would be to ask parents if they would be happy for their child to cross a busy road where there was ‘only’ a one in ten chance of being hit by a car.
Coe et al (2008) carried out probably the most extensive meta-study into grammar schools. Rather than look at how good the 11+ was predicting a child’s performance a week later, they looked at similiar tests taken at age 11 and proposed that “reliability” should relate to the ability to predict academic achievement six years later. They arrived at a figure of 0.70. That doesn’t contradict the figure of 0.90 because the two measures consider the amount of ‘drift’ over very different durations.
Coe et al provided the following plot which graphically illustrates a test which selects 25% of 10-year-olds candidates and is 0.70 reliable at predicting their GCSE results.
This introduces another measure, which features heavily in Data Science, classification accuracy. As Allan explains (2017b), whenever any boundary test condition is approached, the probability of misclassification approaches 50%. Intuitively, children who just fail (or pass) the test by one question know this is true and can often recall a particular question they nearly answered differently. For children near the pass/fail mark boundary, tossing a coin to determine the outcome is almost as reliable.
Yes, but is the 11+ “reliable”?!
What everyone, including the academics, overlooks is that this question really depends on perspective.
As everyone knows, if you repeatedly measure something and take the mean value accuracy increases because individual errors tend to cancel each other out. The same applies when you test a large cohort of children. More formally, the standard error (SE) is calculated as:
That geeky definition can be explained with a simple example of a fully selective county that tests ten thousand children (n=10,000). Those individual errors (σ) are divided by the square root of 10,000 (=100). If the test is 70% reliable at predicting individual GCSE’s, the element of error is 30%. Spread over 10,000 candidates that becomes 0.3% equating to an overall test/retest reliability figure of 0.997.
If the objective of the 11+ is to select a cohort, guaranteed to do well in final GCSE results, then it is extremely reliable. As Gorard and Siddiqui (2016) observe,
Grammar schools use examinations to select children aged 10 or 11 who are predicted to do well in subsequent examinations at age 16. They select well, as evidenced by the high raw scores outcomes of these pupils five years later. This seems to confuse some commentators, members of the public and even policy-makers who assume that the good results are largely due to what happens in the school rather than the nature of the children selected.
In conclusion, whether the 11+ test is reliable or not depends on whether you are a grammar school or a ten-year old child sitting it.
References
Vernon, P. E. (1957) Secondary School Selection, A British Psychological Society Enquiry, London Methuen.
Coe R., Jones K., Searle J., Kokotsaki D., Kosnin AM., Skinner P, 2008. Evidence on the effects of selective educational systems. CEM Centre, Durham University, UK. Commissioned and published by the Sutton Trust.
My long running quest to obtain more data on the 11+ was recently given a welcome boost by campaign group Comprehensive Future. I suggested to them that test results should be included in the National Pupil Database (NPD) and, as reported by Schools Week, they persuaded two dozen of the country’s top academics to sign an open letter asking the government to do just that!
Prof Steven Gorard told the paper that the data would allow researchers to, “conduct powerful analyses of the fairness of admissions to, and the relative effectiveness of, grammar schools”. Schools minister, Nick Gibb wasted no time in rejecting the idea! Perhaps a future government will recognise the value of public debate being evidence based, but these data would also answer the far more fundamental question over how many children are impacted by the 11+.
Schools Week reported, more than 100,000 pupils take over 70 different 11-plus exams administered every year by the 163 selective schools in England. In truth, no-one knows how many children are impacted by the test because we don’t have the data … which was the whole point of the open letter!
First estimate
Grammar schools make up one in 20 places in state funded education. That might lead to a common misconception that the test only impacts 5% of children, but obviously far more children sit the test than are admitted to grammar schools.
CEM disclosed they tested 57,281 children in 2016 which they thought was 40% of the commercial market. If anything, that is conservative given that they provided tests for about half (81 out of 163) grammar schools but going with this, the total number of commercial tests would be about 143k. A handful of schools still write their own test bringing the total number of tests in 2016 to 150k. About 600k children start secondary schools each year providing a first estimate that one in four are impacted by the 11+.
Increased numbers per school
CEM disclosed further information about testing in 2017/18/19. There was a reduction in the number of schools using their tests, but those that continued showed an average 6.5% increase each year in the numbers being tested per school.
That lends itself to another estimate of numbers over time, taking the mean number tested per school and multiplying this by the 163 grammar schools in the country. In 2016 CEM tested an average of 700 children per school. By 2019 this had risen to 850/school, giving the following figures:
Estimate of number of 11+ tests in England 2016-2019
Comprehensive Future questioned why these figures per school were so high. They had data from 2017 which, although not so recent, showed the average tests per school for 59 grammar schools in Kent, Medway, Essex and Lincs, which all use GLA’s tests, was 411, compared to CEM’s 765 for that same year! Clearly, if CEM test more per school than GLA, then the above method over-estimates the total.
At first there do not seem to be any reason why one test provider would test more children per school than another, but the answer may lie in there being two distinctly different types of selection.
‘Normal’ grammar schools set a qualifying score and then use other admissions criteria, such as catchment, siblings and ultimately a distance based tie-breaker to determine who they admit.
‘Super selective’ grammars work with a large, or populous catchment, rank all candidates and offer places to the highest attainers.
‘Super selection’
Education is run as a ‘market economy’ and selecting the highest prior attainers ensures good raw attainment at GCSE. This ensures ‘super selectives’ are top of the league table which makes them popular with parents, who assume these results are something to do with the school rather than its admissions policy. This creates even more demand for places in what economists refer to as a positive feedback loop.
Age weighting is normally based on birth month. CEM base it on the candidate’s exact date of birth and provide scores to two decimal places, a practice Oxford’s Prof Steve Strand once described as ‘wildly over precise’. As explained in How reliable is the 11+, the test is generally good at selecting a cohort and CEM’s method of ‘standardisation’ allows ‘super selective’ grammars to finely tune that to maximise prior attainment.
Best estimate
CEM’s tests may be popular with ‘super selective’ grammars, which also tend to have greater competition for places. Whatever the actual reason, the available data indicates that those schools which use CEM’s tests tend to also test more candidates. The total number of tests is probably somewhere between Schools Week’s figure of 100k and this estimate of 140k. The mid-point of 120k is 1/5 of an annual cohort of 600k children.
That is the number of tests rather than children taking them and some children sit multiple tests however the figures are for 2019 and increasing annually at about 6.5%. Whilst the amount of double counting where children sit multiple tests is anyone’s guess, the increase in total sittings tend to cancel each other out so the best estimate remains 120k or 1/5 of all children are impacted by the 11+ each year but this remains an estimate. The information which would enable this fundamental question to be answered is not being made available and the real takeaway is that we simply do not know how many children are impacted by this test. The grammar school heads argue that making data available for research would lead to misleading comparisons. The government minister said data already collected allows the progress of children within schools to be assessed, including for disadvantaged children. It is difficult to see a good reason why anyone would want public debate to be based on ignorance.
Cost to the taxpayer
The disclosure made by Durham University in 2016 also showed that CEM earned £815,801 from testing. There is some debate about whether CEM or GLA’s tests are more expensive but, taking the same simple approach that they are similar and CEM’s share is 40% of the total revenue, the total annual cost comes to just over £2m. Some would argue that money would be better spent on improving education for disadvantaged children who are set to be hardest hit by the government’s callous change to FSM eligibility calculations.
This article was updated 20 September 2021, following the feedback and additional data provided by Comprehensive Future.
21 Sep 2024 - The Guardian:Coverage of successful appeal to get raw 11+ marks disclosed."
4 Dec 2021 - The Guardian:Exposé of selective schools' "creative ways to poach students".
12 Feb 2021 - Schools Week:Open letter from UK's leading academics asking for 11+ results to be linked to National Pupil Database.
18 Sep 2020 - Schools Week: Government £50 million expansion scheme to improve access for poorer pupils creates “more places for the middle classes”. 26 Feb 2019 - Guardian: Grammar school expansion [SSEF] still locking out the poor. 27 Sep 2018 - TES: Grammar heads wanted admissions that would illegally favour local pupils.


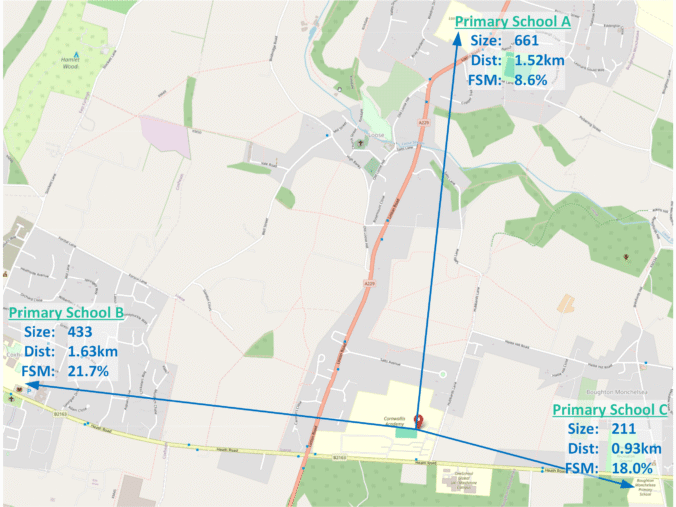

 ). These relative values can’t be used directly so the first step is to add them up (692).
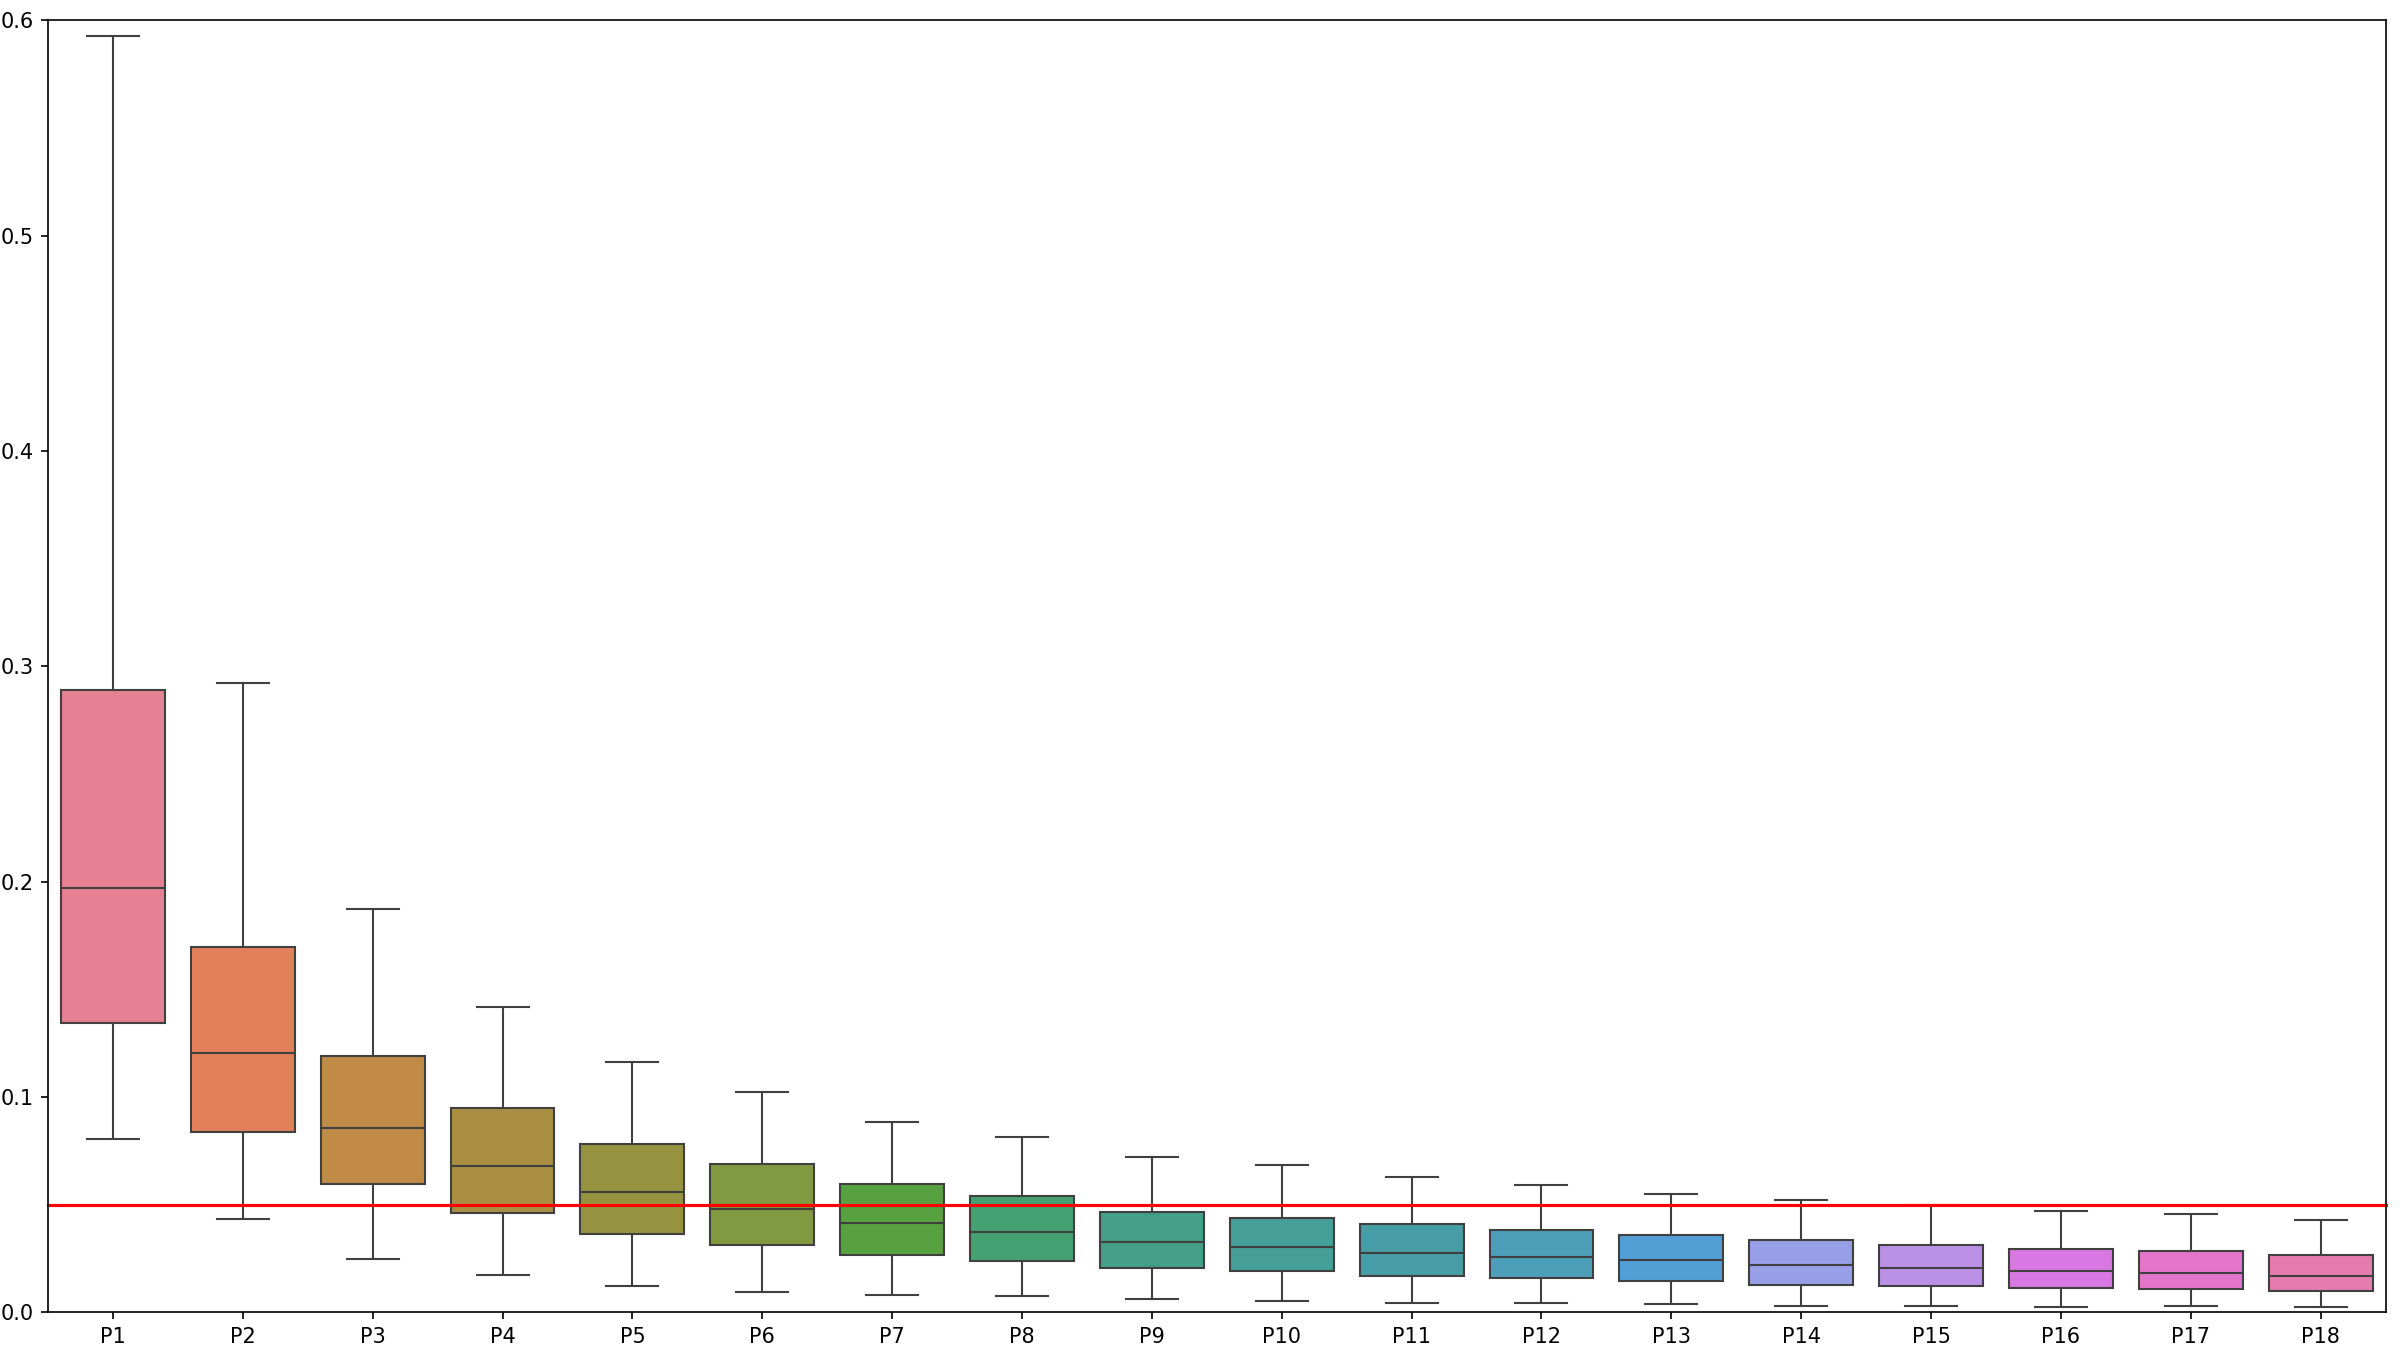
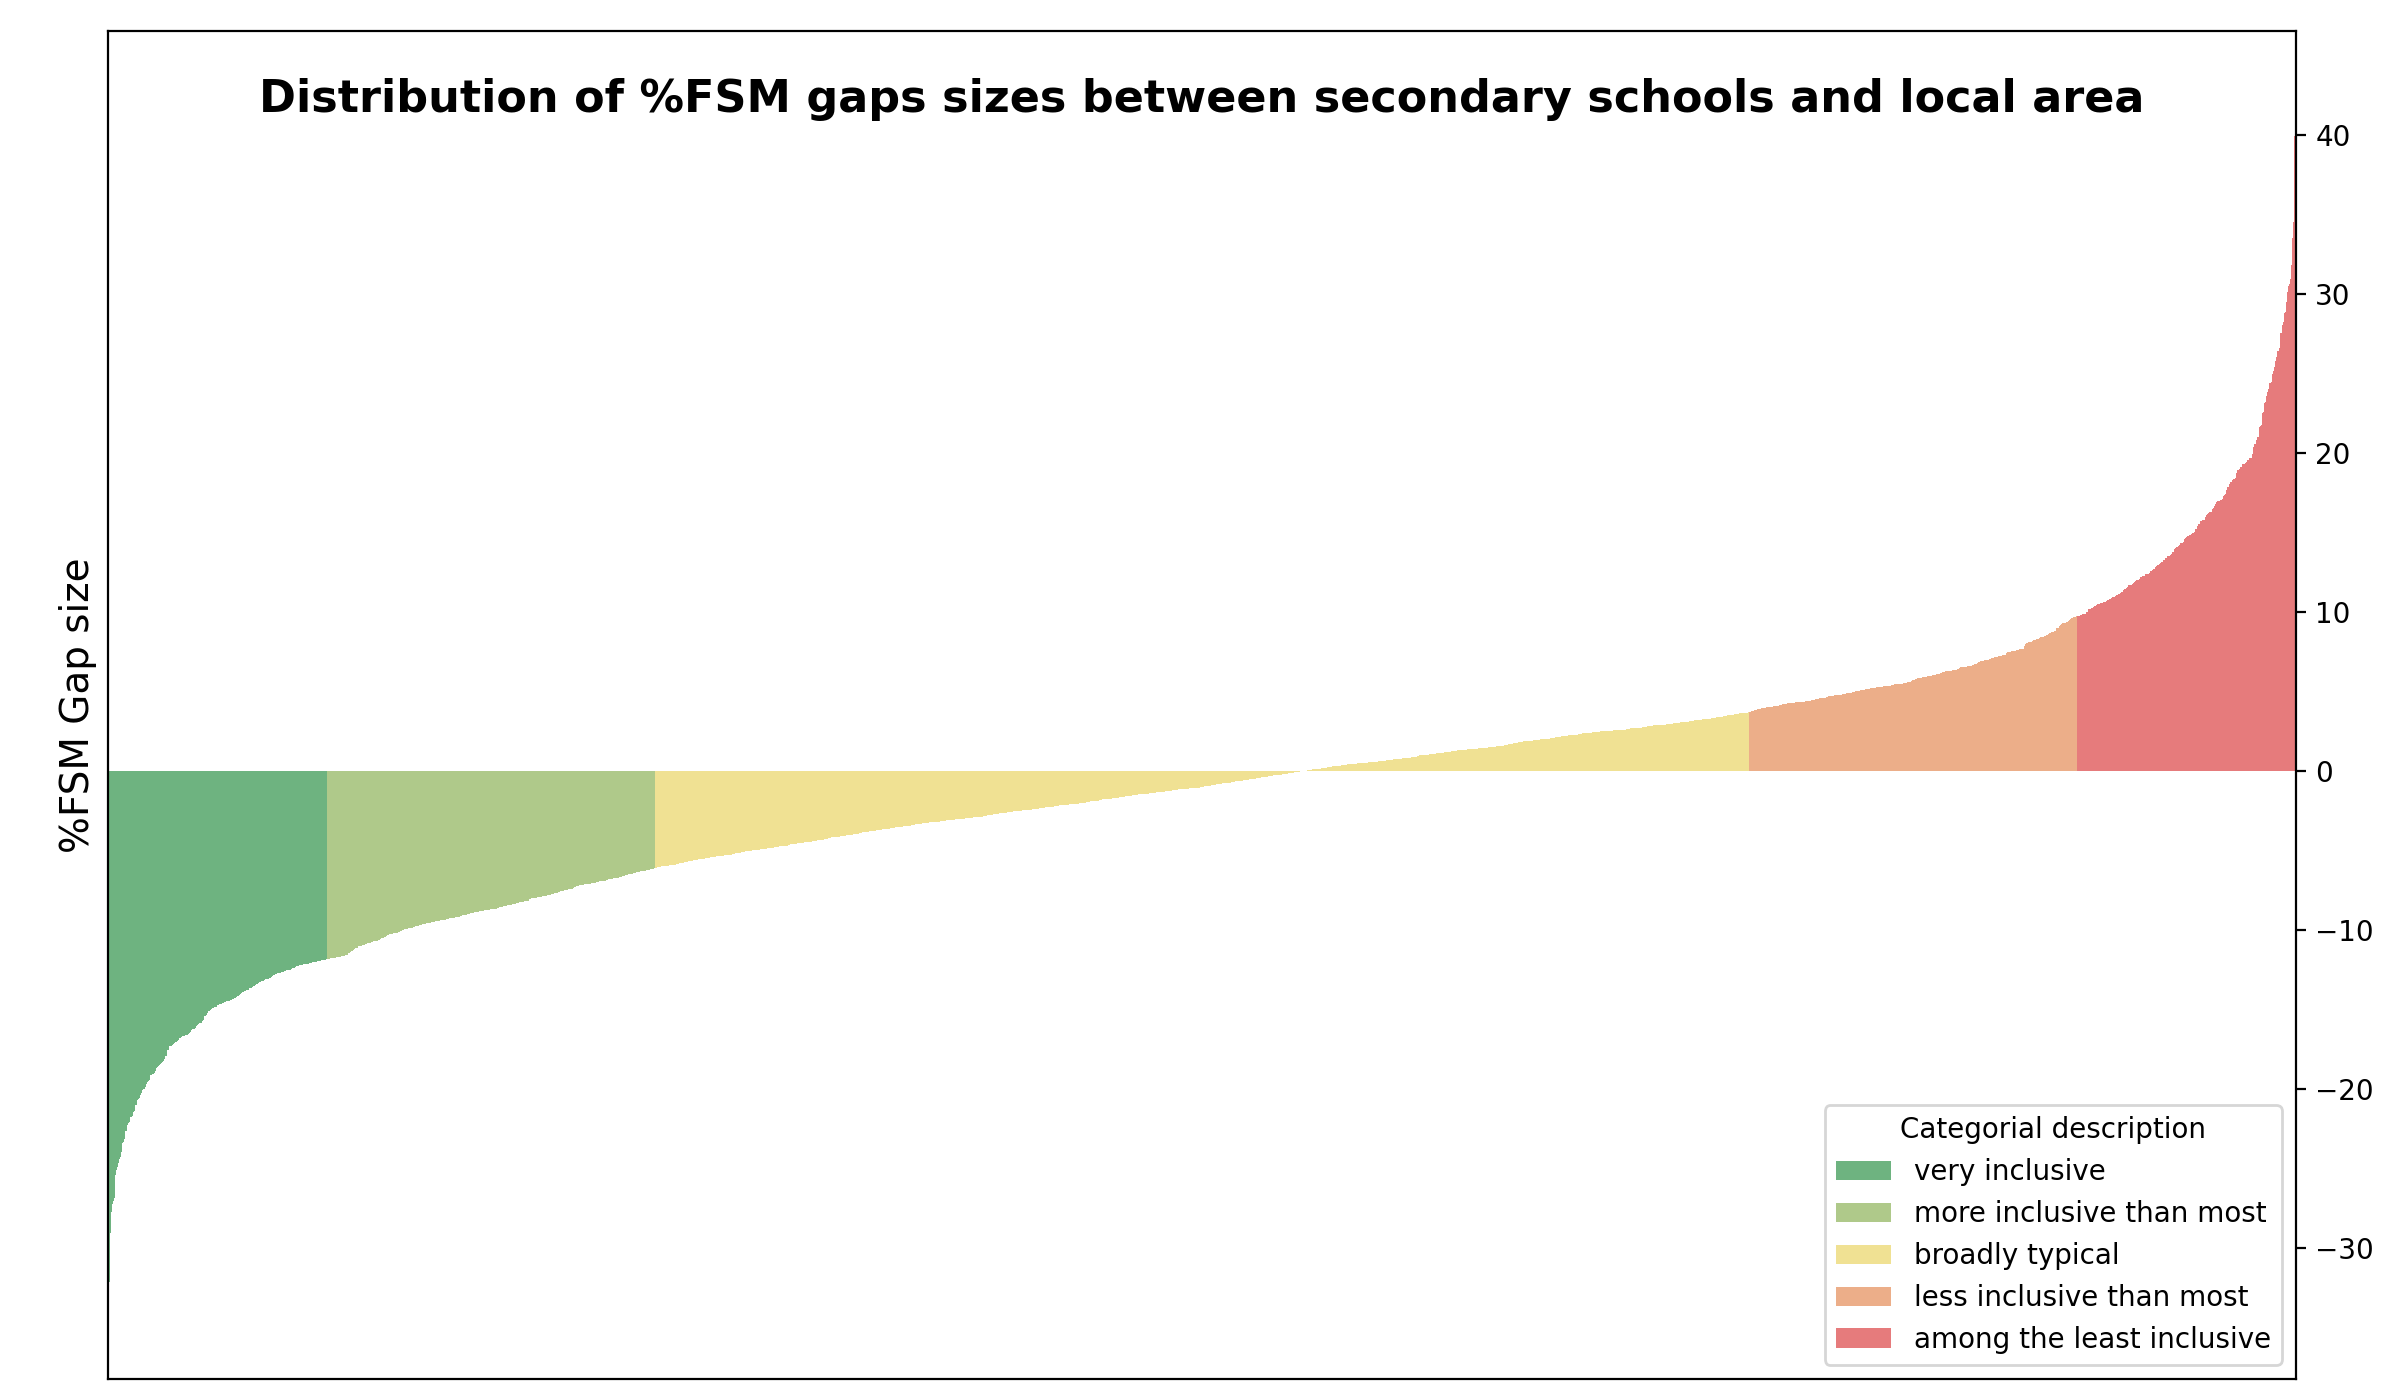

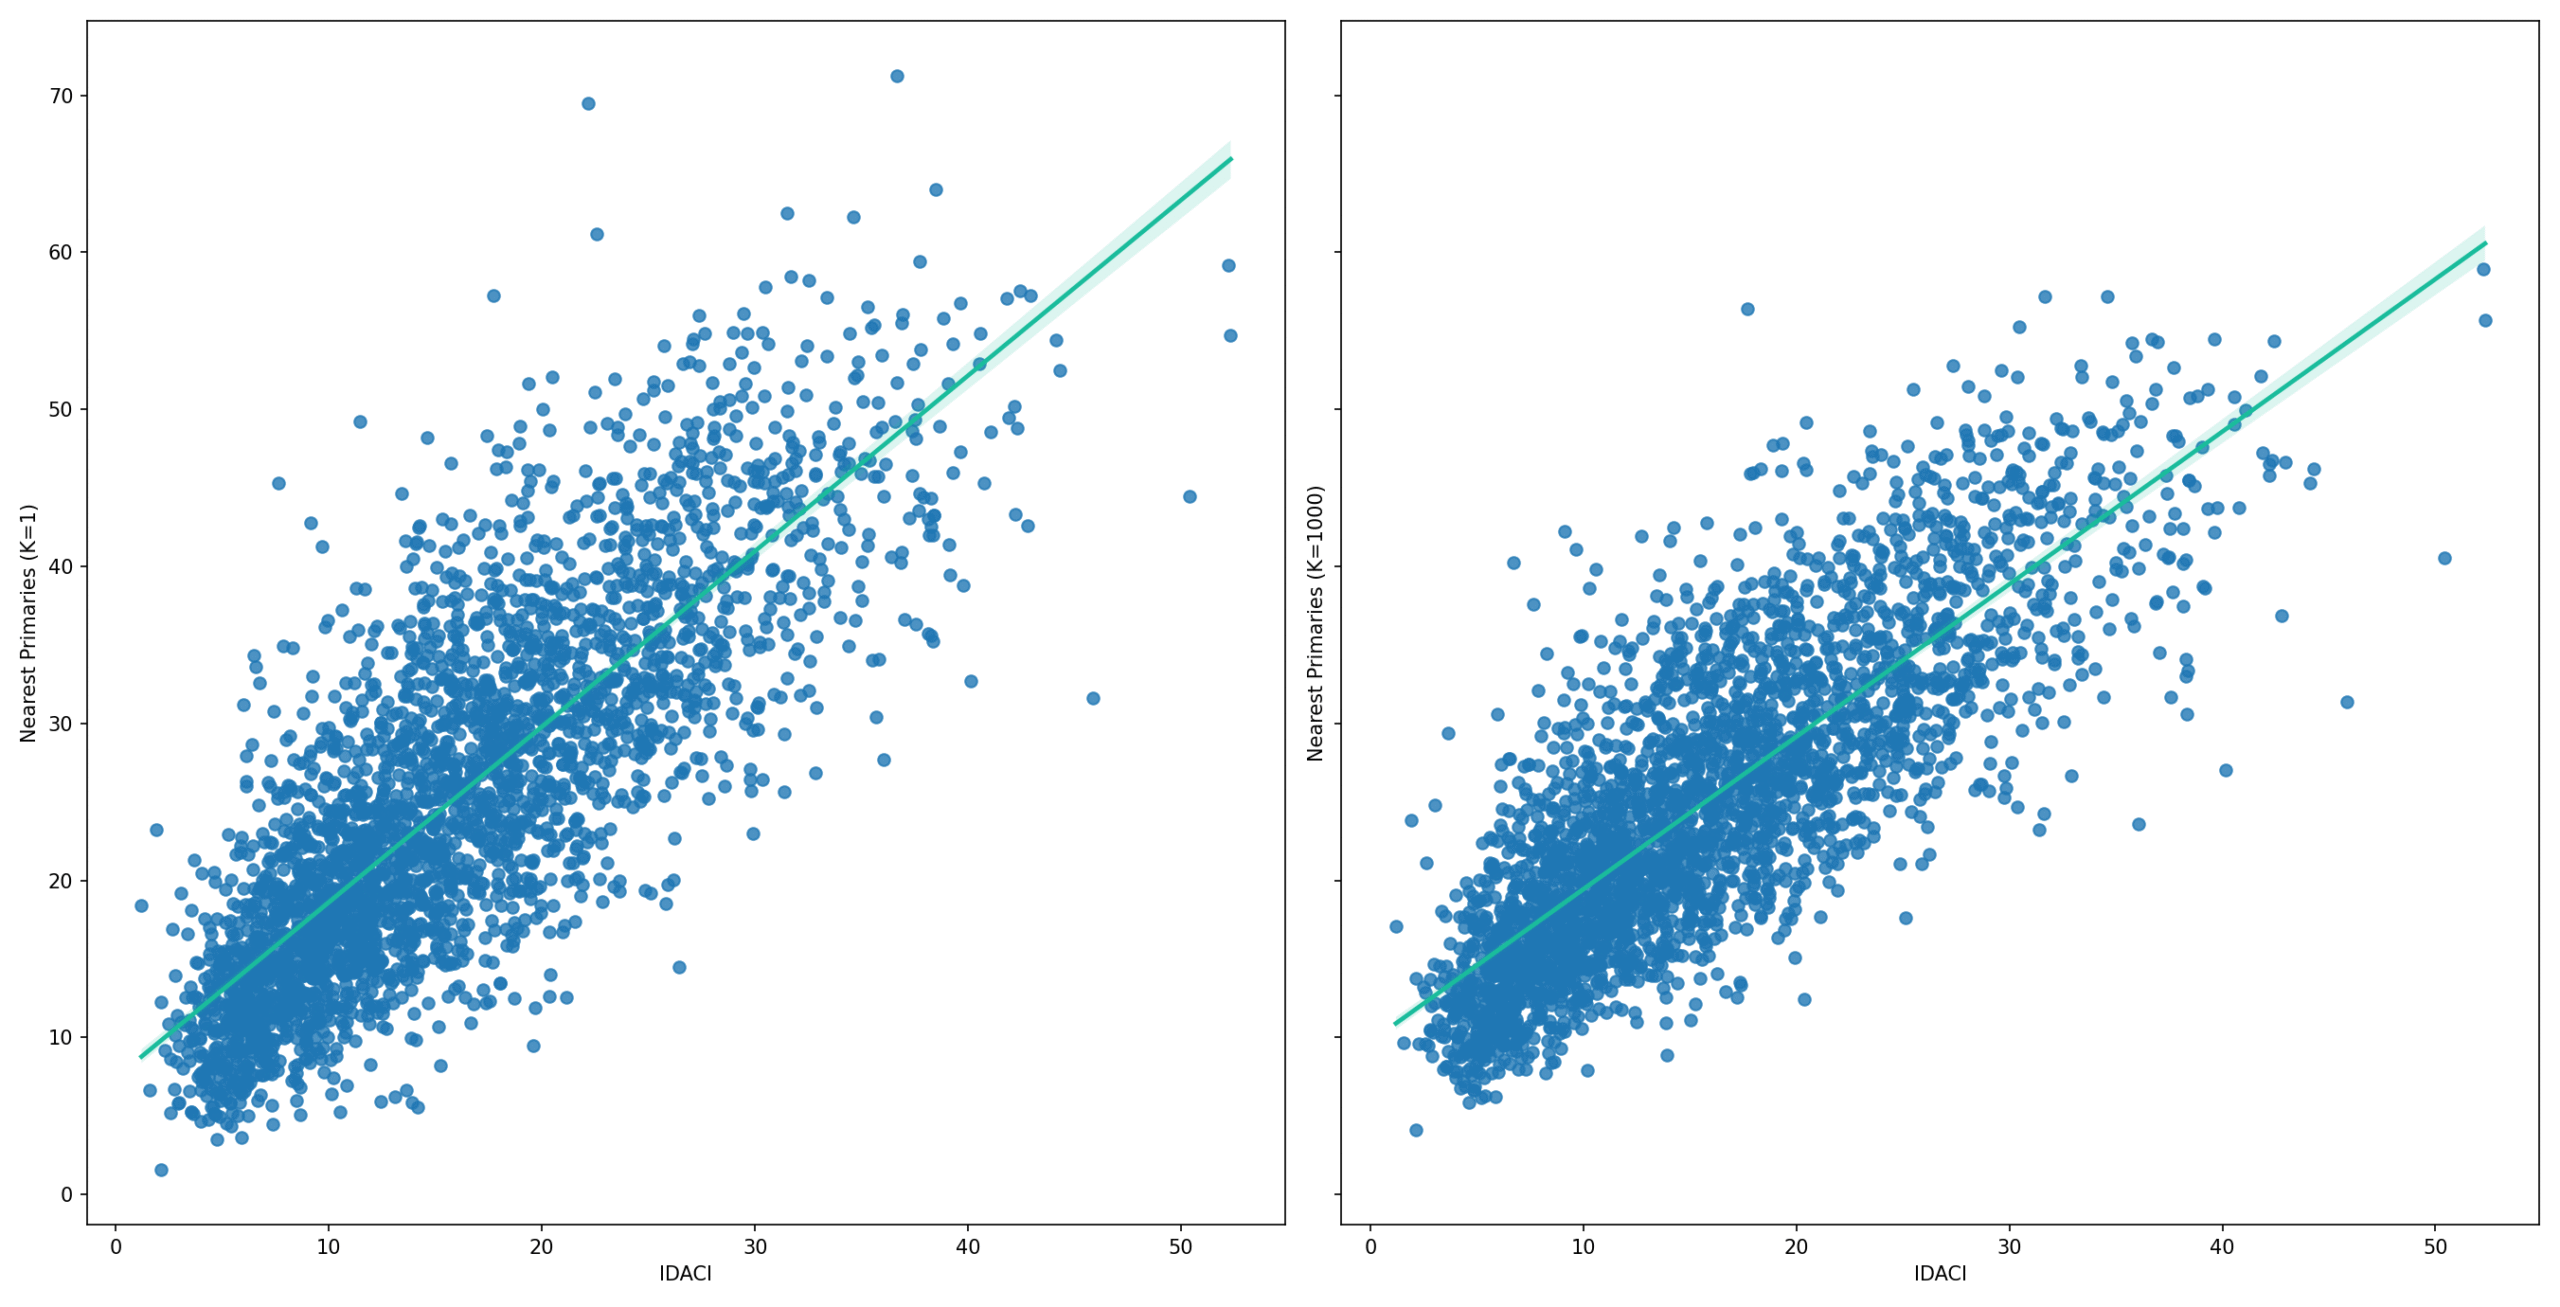
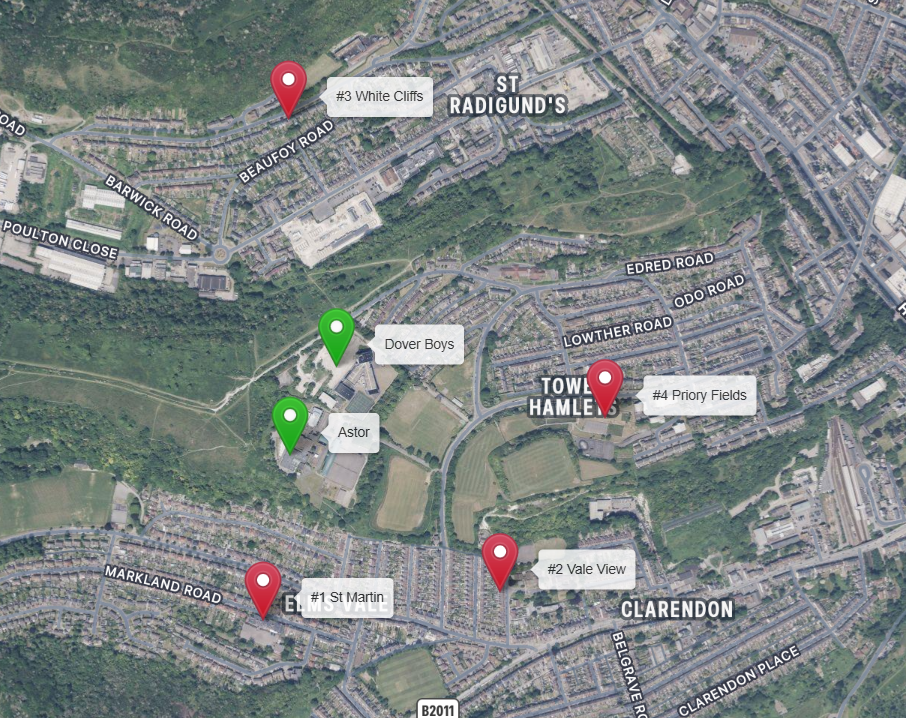
 to the distance to each primary school:

 (1 kilometre) the difference in ‘local area’ FSM between these two schools drops to a very reasonable 1.5%.
 primary schools and formally expressed as:
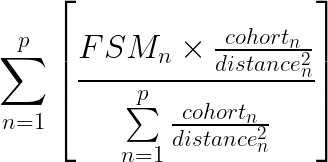
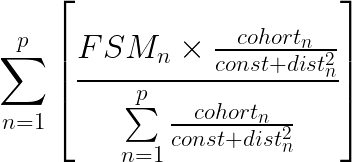
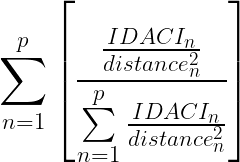

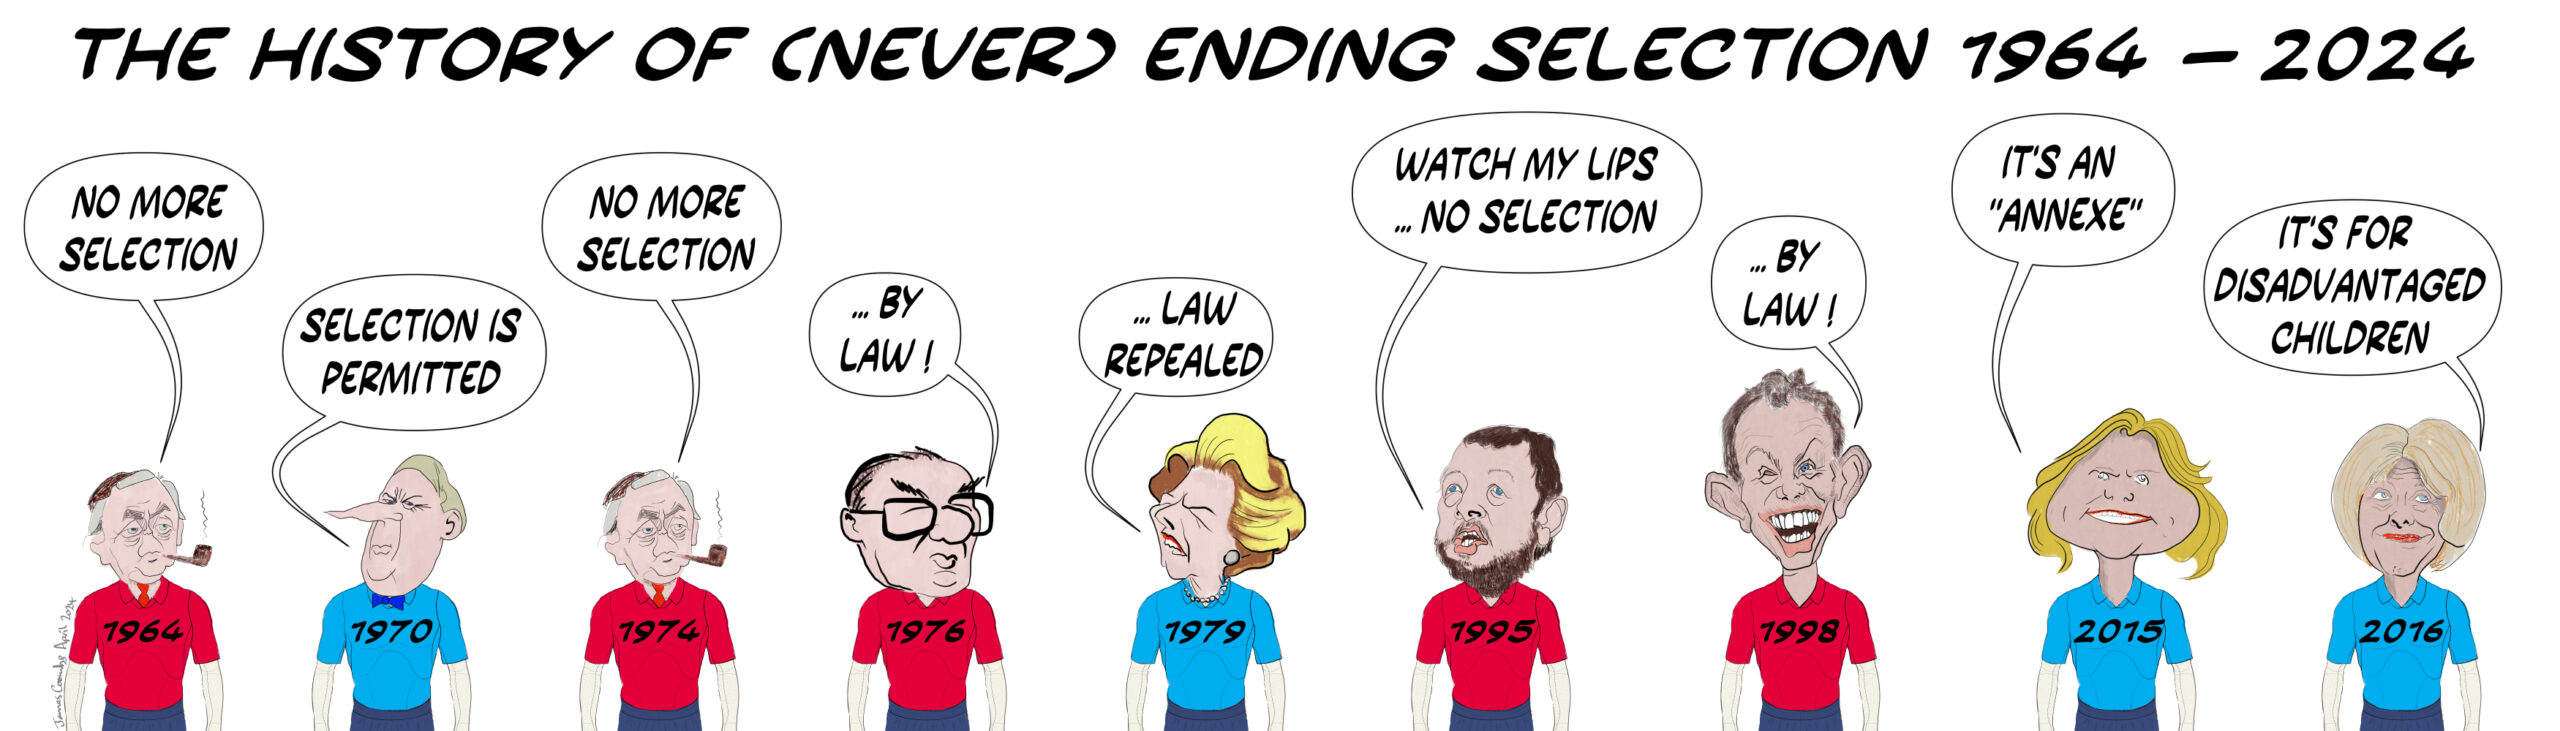


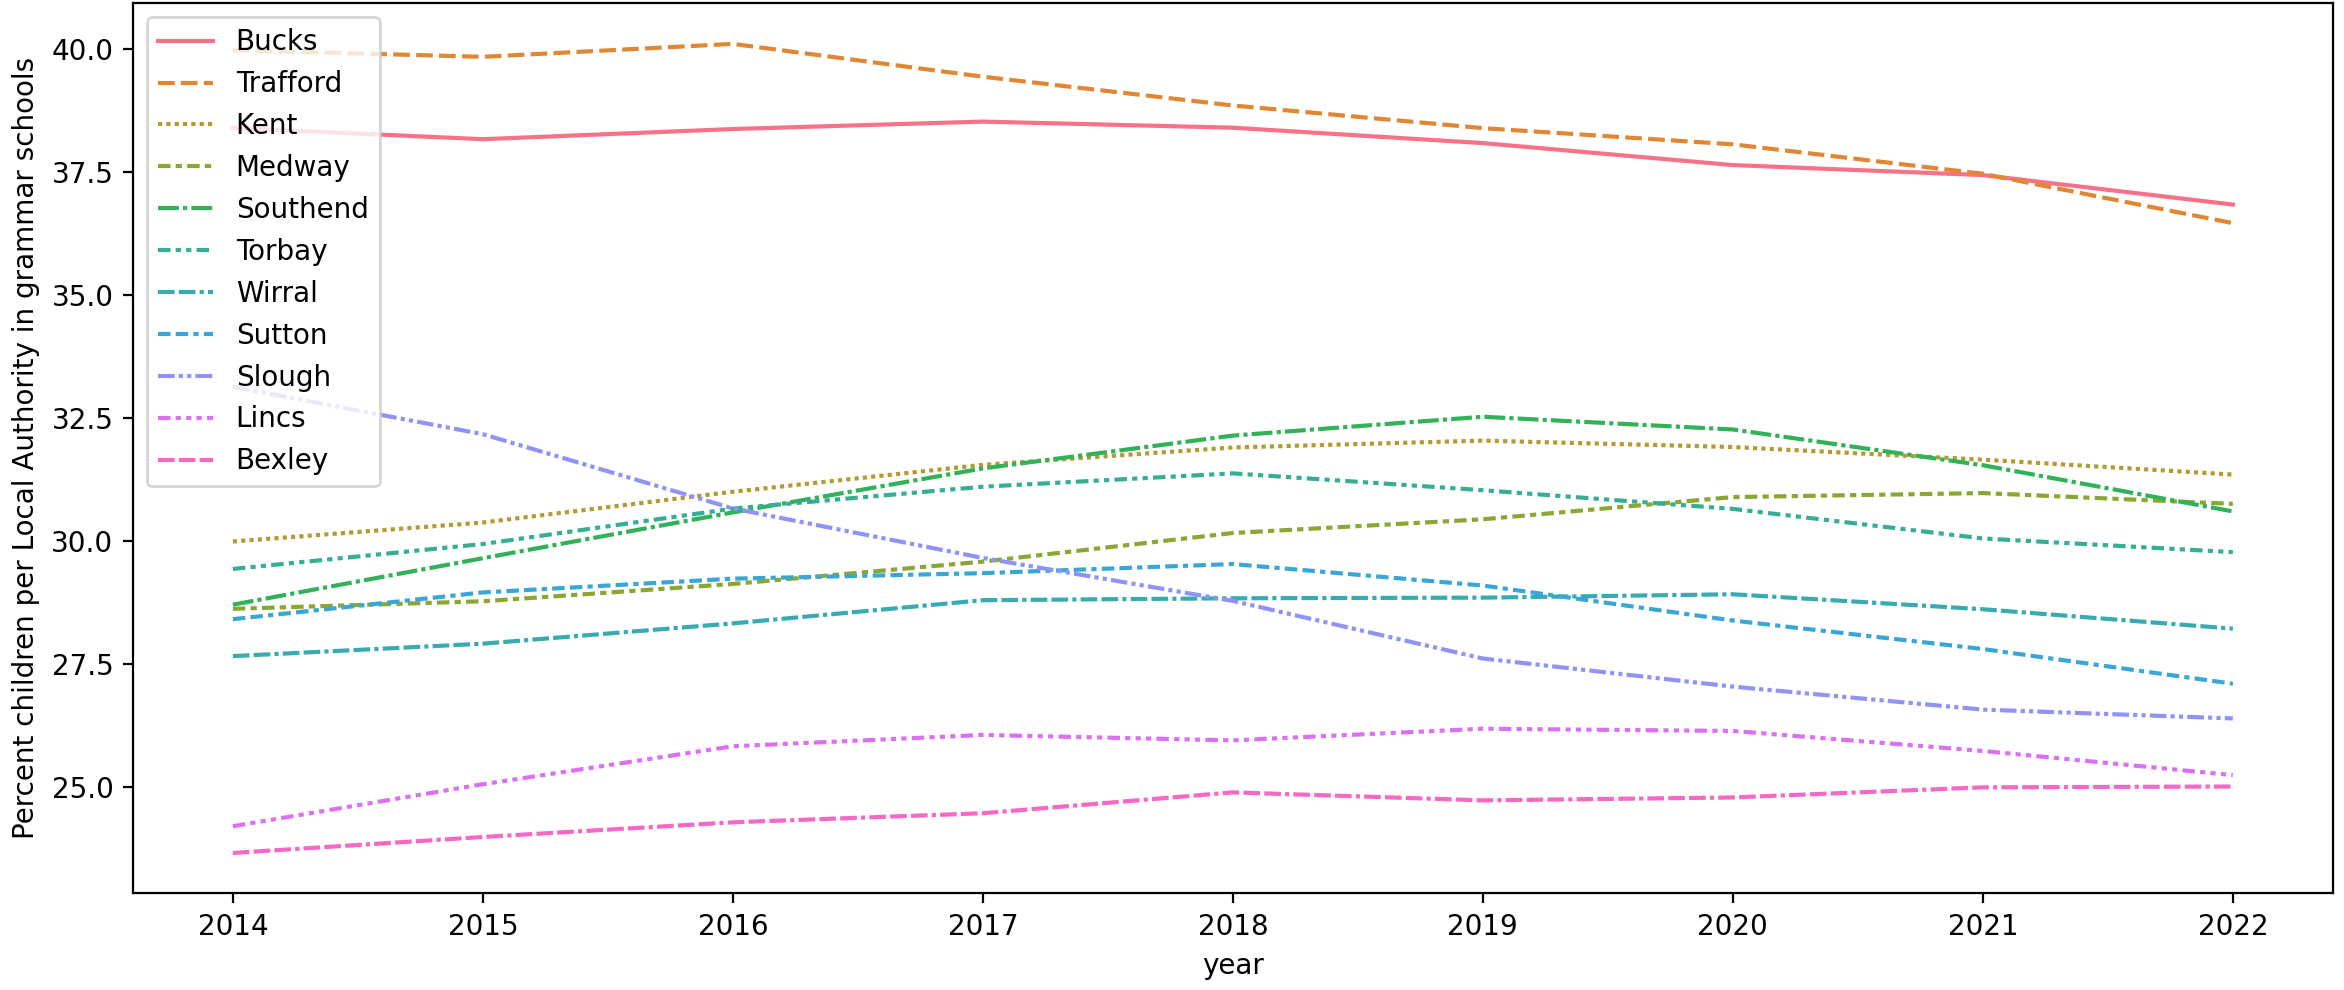
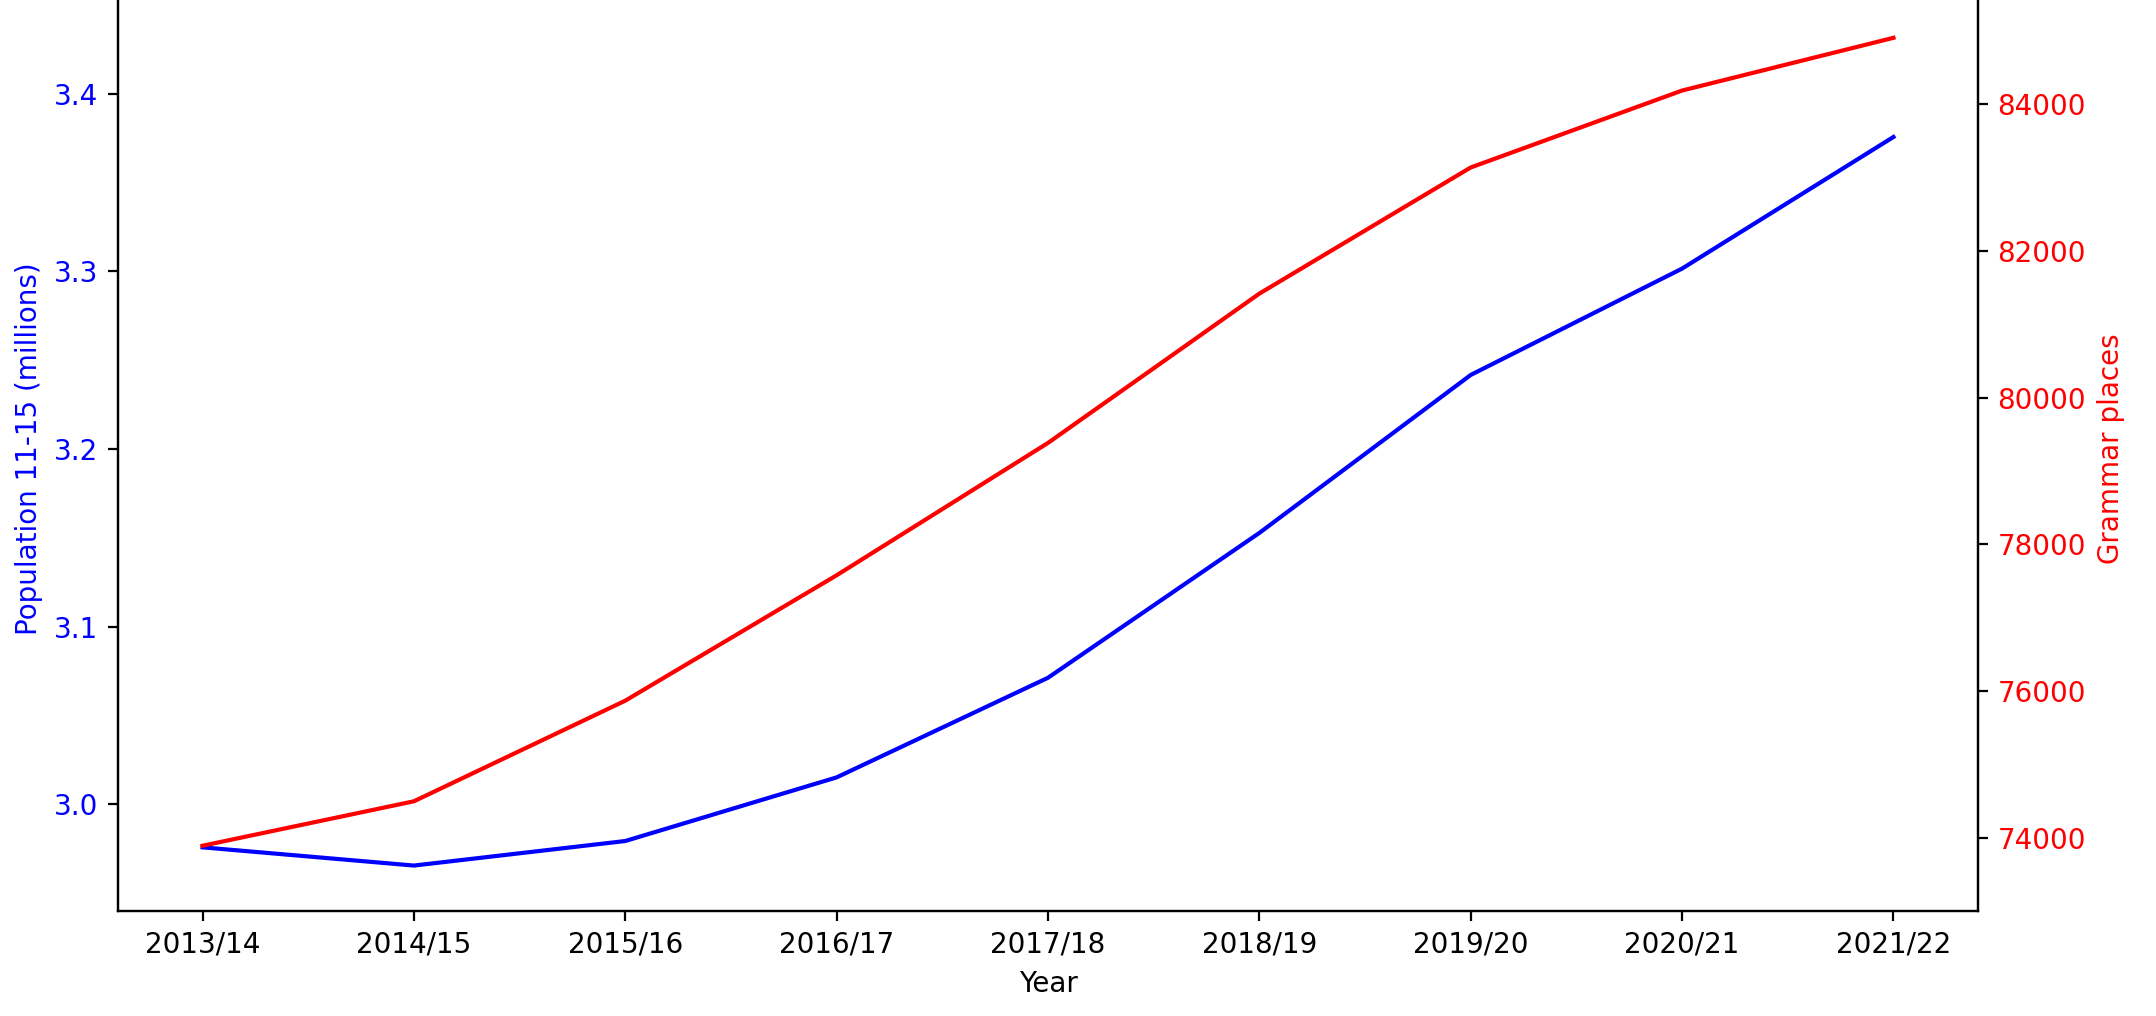
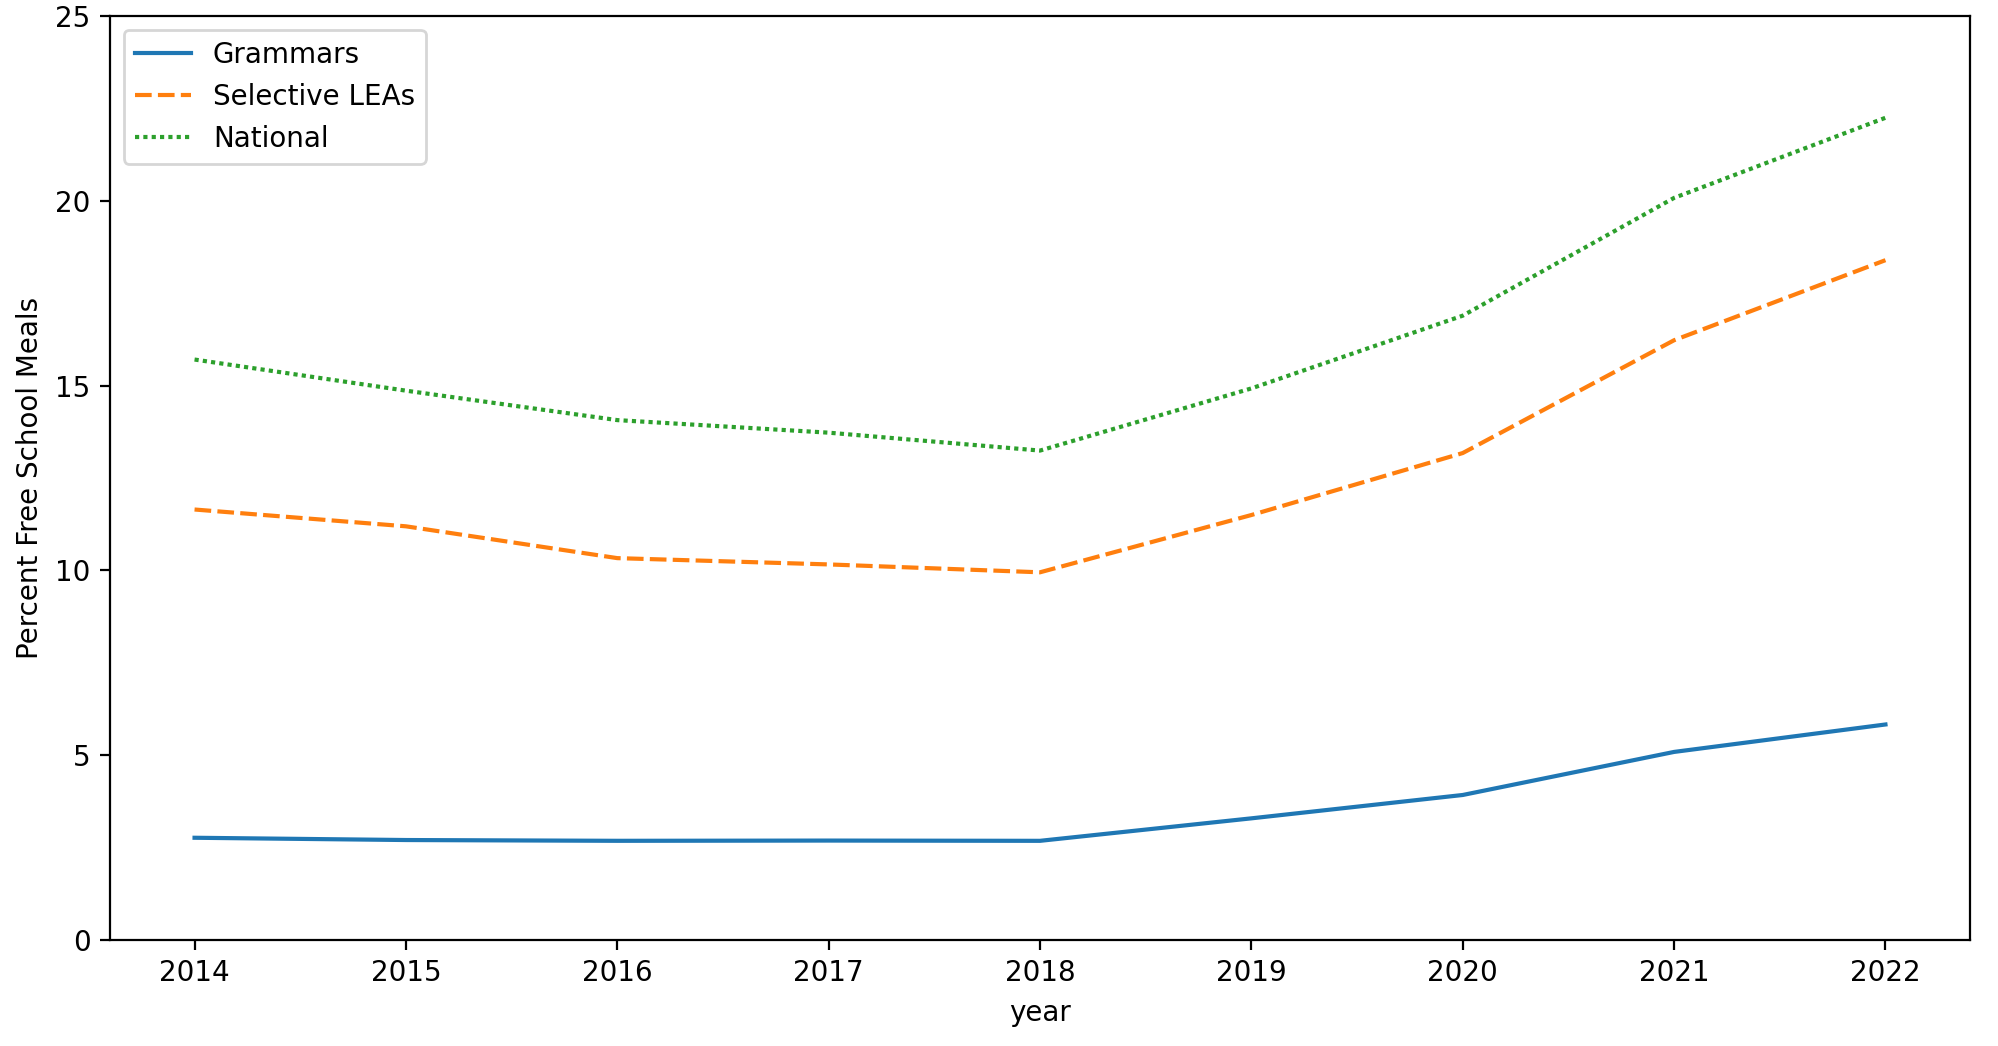
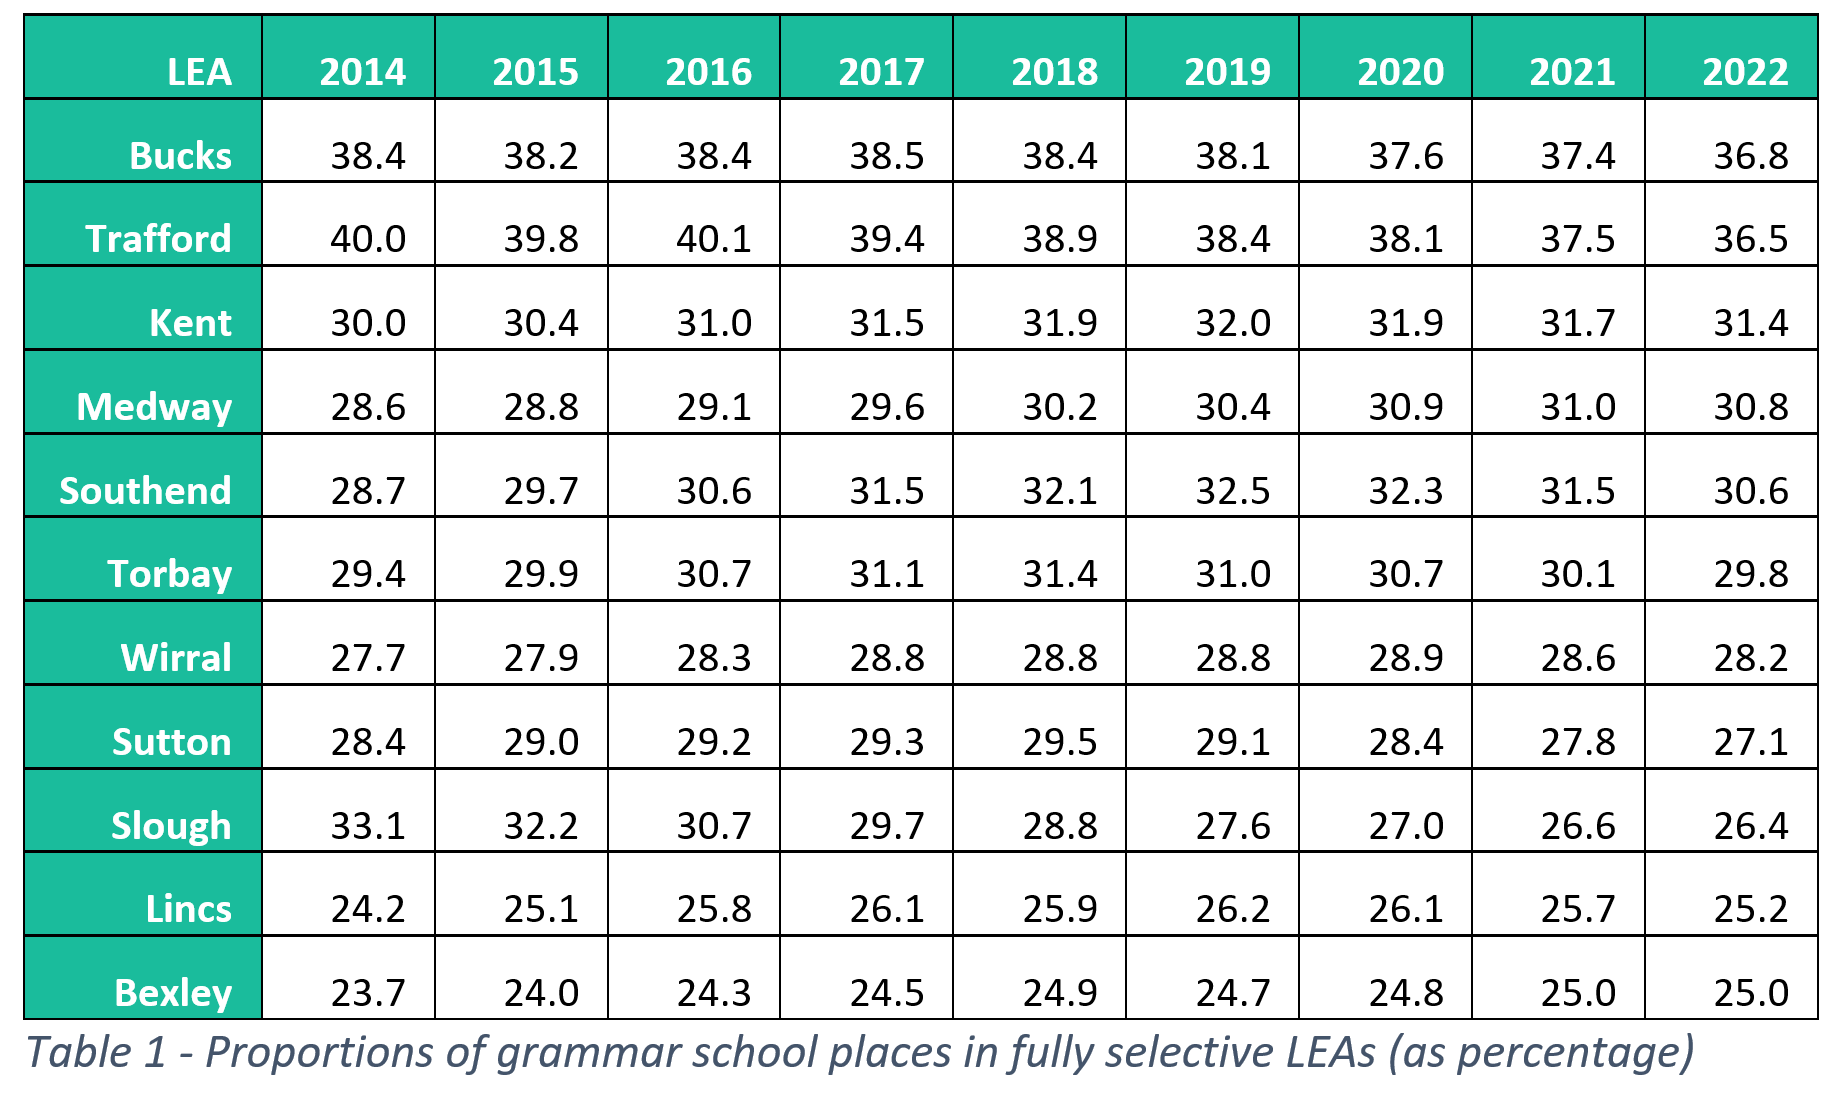


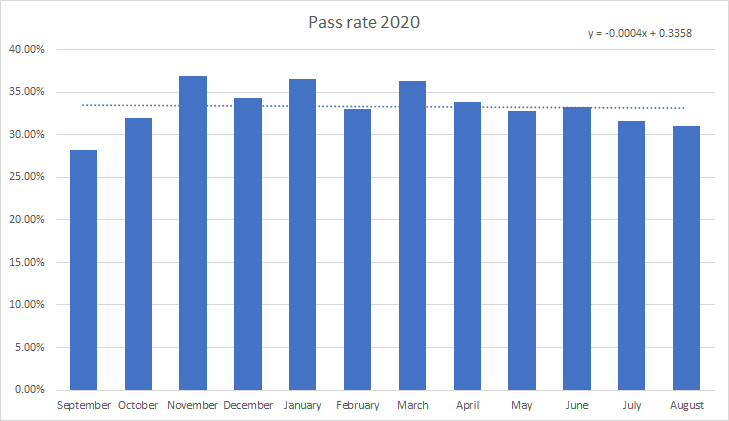
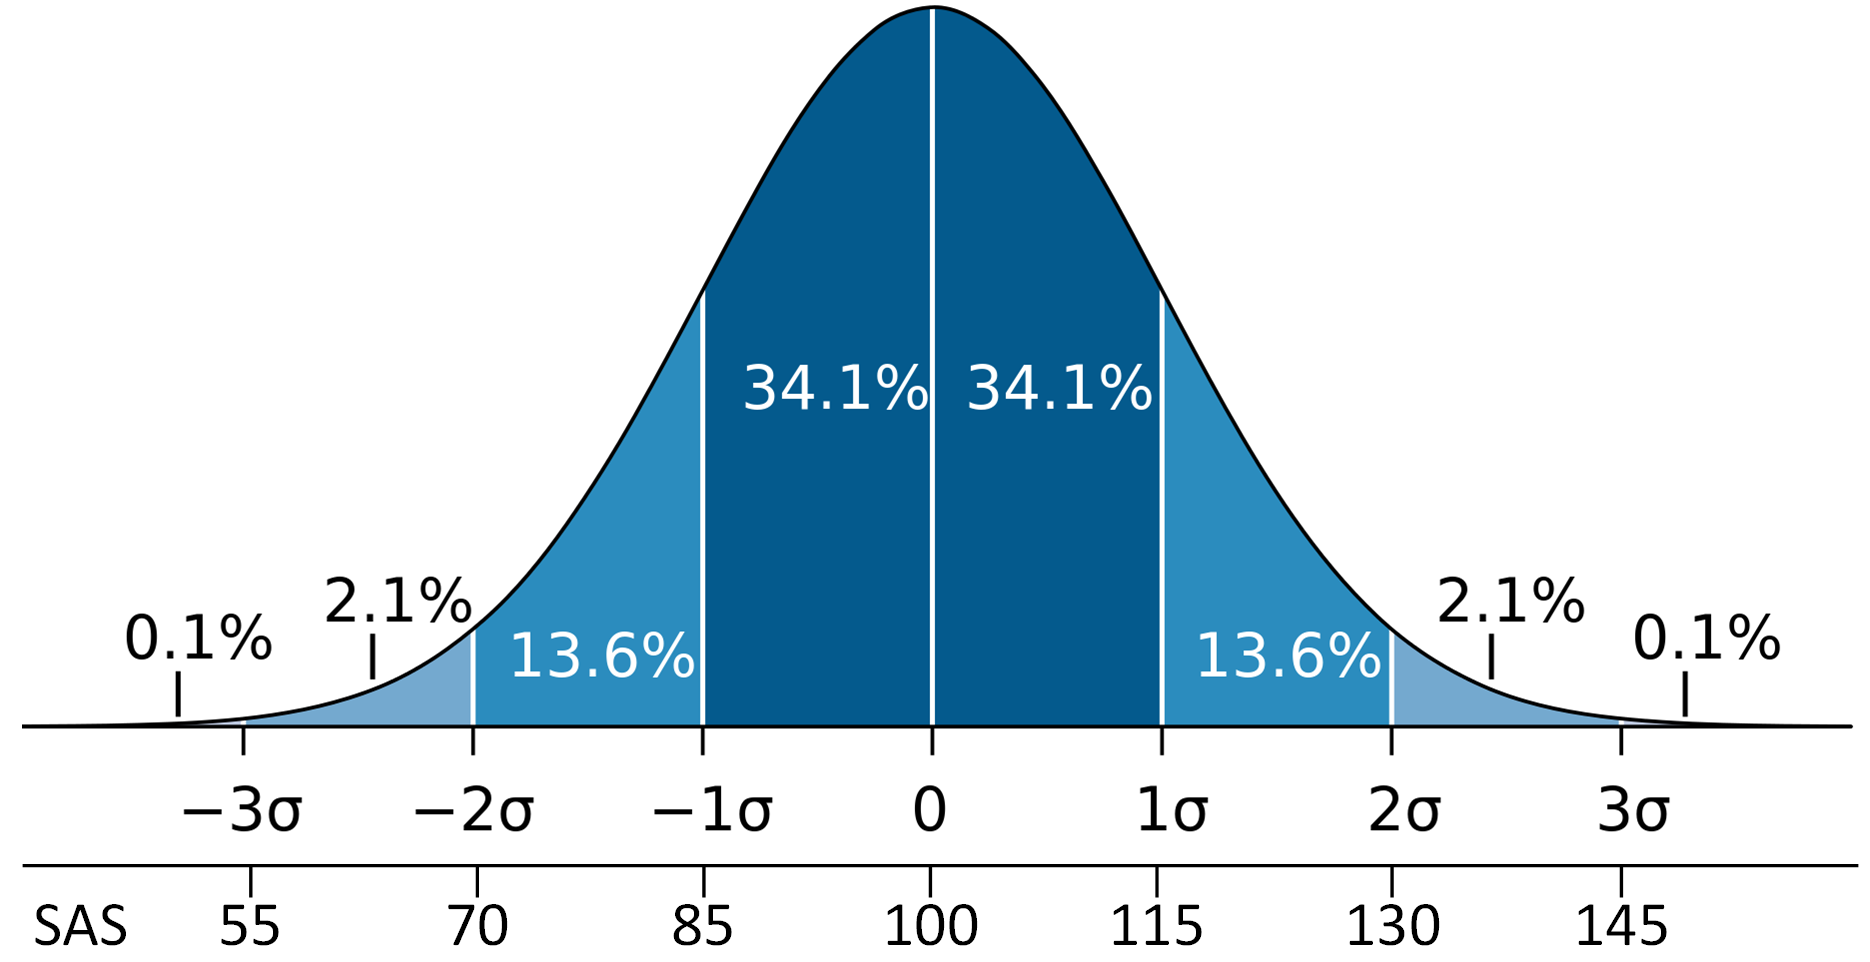
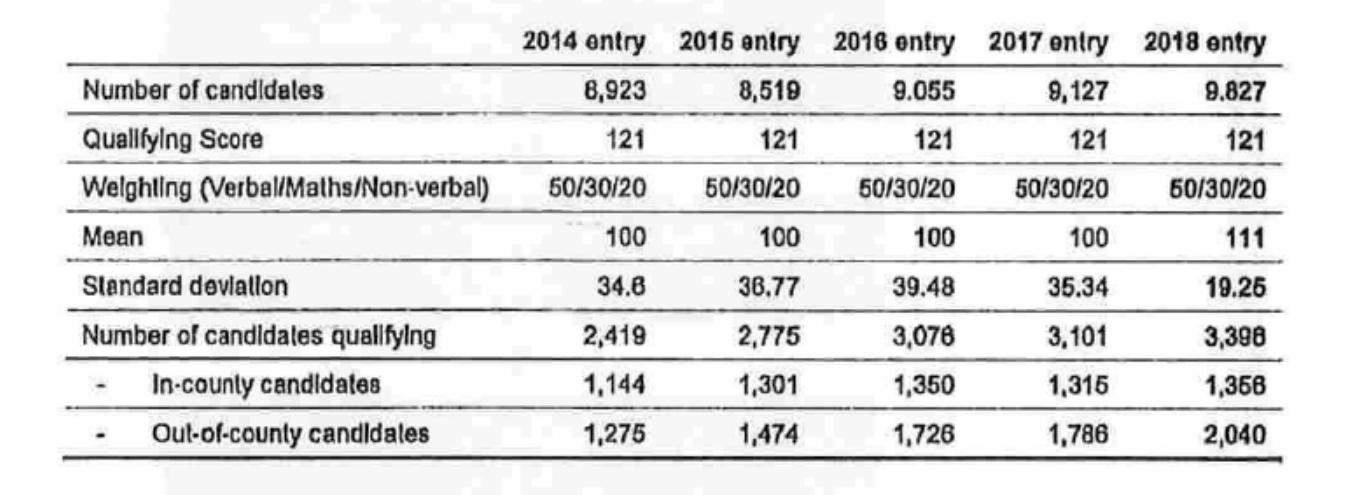

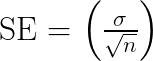


Recent Comments