Equality in Education

Category: Uncategorised (Page 2 of 4)

A Sankey view of schools

YouGuv created this Sankey diagram to illustrate what effect Brexit would have on a second Scottish independence referendum.

It turns out, the answer was not a lot, but the choice of diagram is good for representing the interaction between different dimensions (in this example, historic voting and future intentions) within a given ‘population’.

Sankey diagrams consist of three key elements:

  1. Nodes: These are categorical values. A finite, ideally relatively low, number of options such as voting “yes”, “no” or “don’t know”.
  2. Dimensions: These are a collection of nodes. In this example, one dimension is how people voted in the past, the other is how they intend to vote in future.
  3. Pipes: These represent the number of people that belong in specific nodes for each dimension. For example those who voted Remain and Yes (yellow) but now intend to vote No (purple) are represented by the thin solid yellow line.

Sankeys are a bit like having multiple pie charts but throwing in the ability to see how many of those in a given slice of pie map to a completely different chart. Here we can see from the slenderness of the solid yellow line that not many people voted Remain/Yes but now intend to vote No. Conversely, fat pipes show a correlation between nodes between different dimensions. The prevalence of fat ‘pipes’ shows that the Scots haven’t really changed their minds that much.

Sankey and school stratification

I wanted to see how well Sankey diagrams could illustrate the different facets of secondary education within a local authority. Starting with datasets published by the DfE (Schools Pupils and Characteristics and the England KS4) I extracted data for the 20 secondary schools in Wirral to obtain the following dimensions:

  • Socioeconomic status [FSM|non FSM] (FSM = Free School Meals)
  • KS2 Prior attainment [low|medium|high]
  • Sex [Boy|Girl|Coed]
  • Admissions policy [Grammar|SecMod]

This post contains a selection of the good the bad and the downright ugly which can be derived from these data.

SES >> School

Producing Sankey plots is very labour intensive because each node and pipe needs to be individually defined with three or four parameters. This was my first working example, mapping the numbers of FSM children to each school.
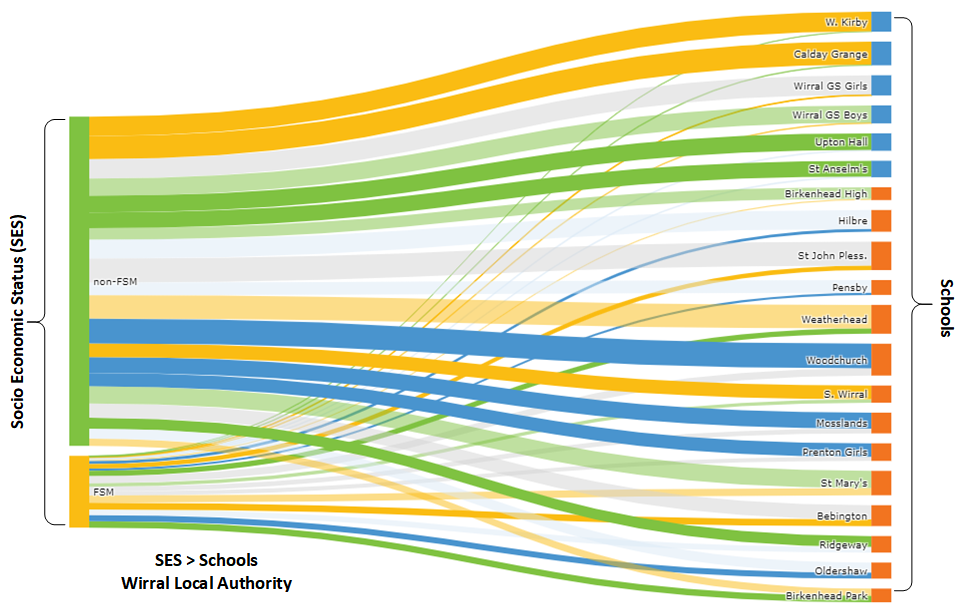
Plotly’s implementation of Sankey auto-arranges the nodes to minimise the amount of crossing over but as a consequence, all the grammar schools (blue) are at the top. This wasn’t intentional!

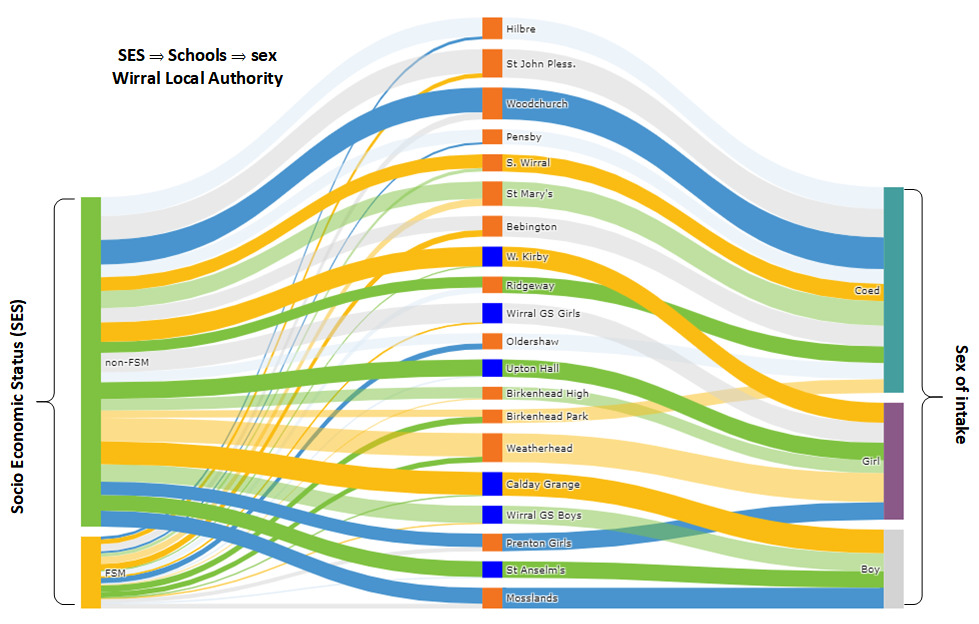
SES >> School >> sex

For the next plot, I added the sex of those admitted. This is a categorical variable describing the school’s admissions policy so each school leads to only one (sex) admissions policy type. This mixes up the schools which I prefer.
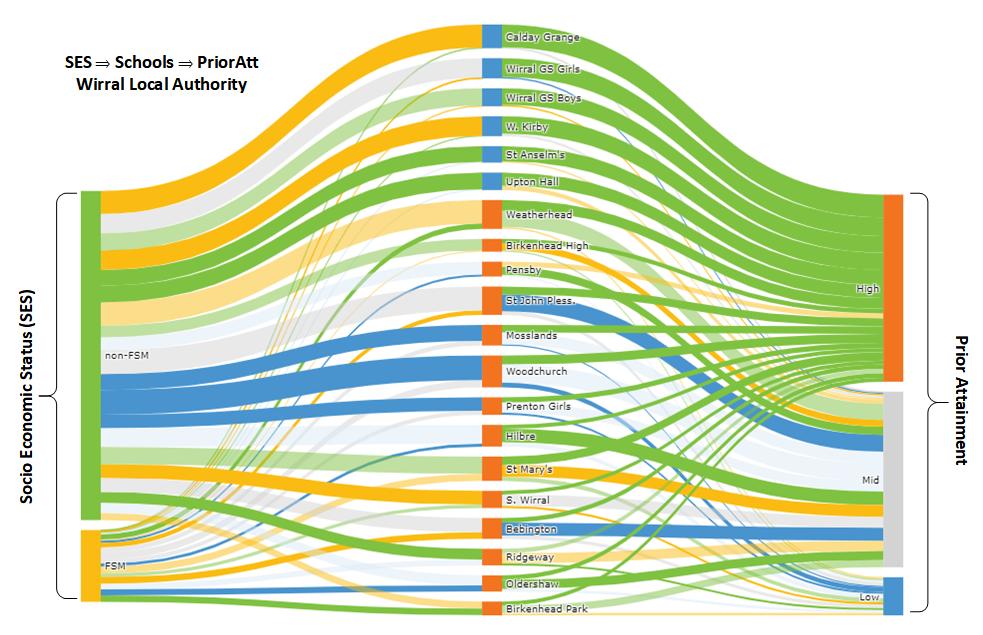
SES >> School >> PriorAttain

This time the rightmost dimension is prior attainment and once again plotly ends up sorting the schools by admissions policy!
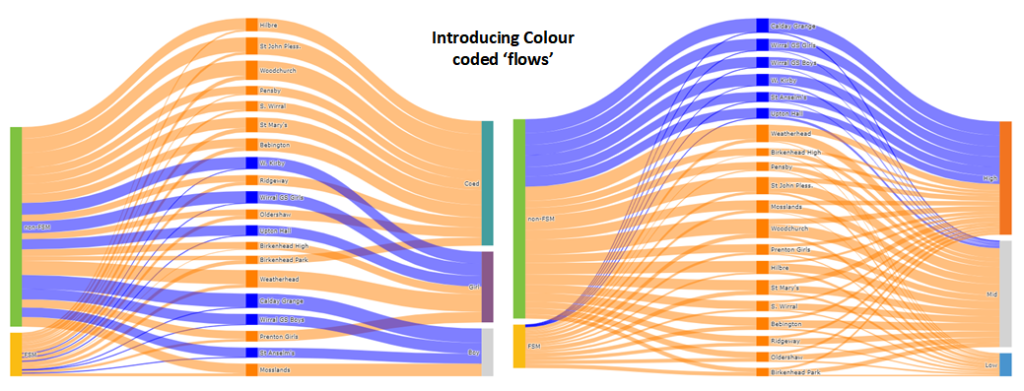
Coloured flows

Because of the effort in manually specifying every element of the chart, up to this point the colours were all random. These two plots were a repeat of the previous two but with some colour coding of the ‘flows’. (Blue=grammar, Orange=SecMod)
Four dimensions!

My first attempt to get four dimensions (prior attainment, SES, School and sex) on a single graph.
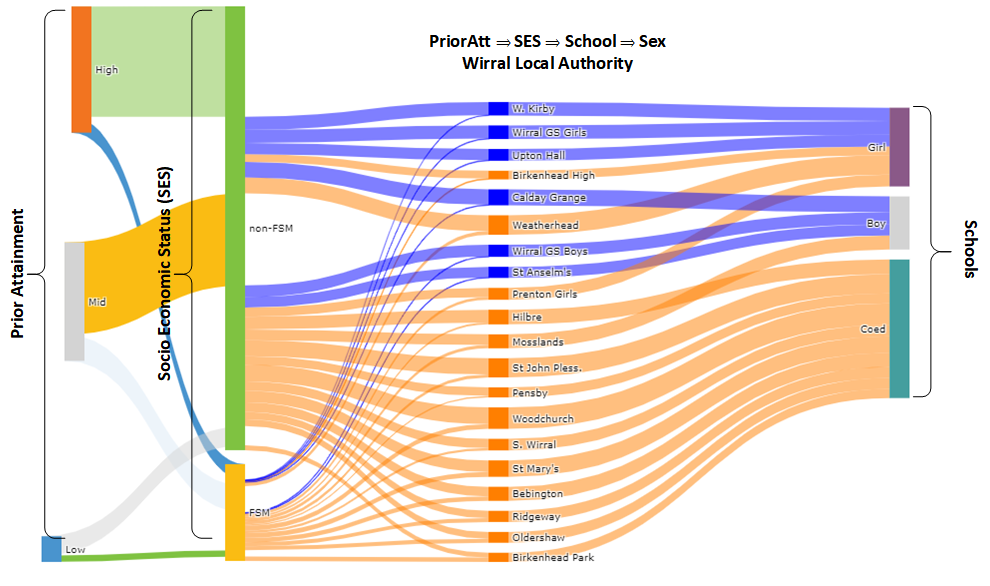
Well it’s interesting! It demonstrates a limitation with Plotly’s implementation of the Sankey graph. There are exacly 17,800 children in this cohort, regardless of how they’re divided. The widths of all the ‘flows’ add up to the same in each section. The nodes should also add up to the same height, but the non-FSM|FSM nodes are twice as high as they should be.

It’s as if Plotly treats the 17,800 children flowing from prior attainment (far left) to SES as a completely different cohort to the 17,800 children which flow from SES into the schools. There seems to be a maximum of three possible dimensions, although colour can add further information.

SES >> School >> [PriorAttain AND sex]

This plot covers the same values as the previous but here prior attainment are both on the right. It sort of works, but notice that for each school the ‘outflow’ on the right is double the size of the ‘inflow’ on the left.

Two in two out

One way to ‘fix’ is to add another dimension …
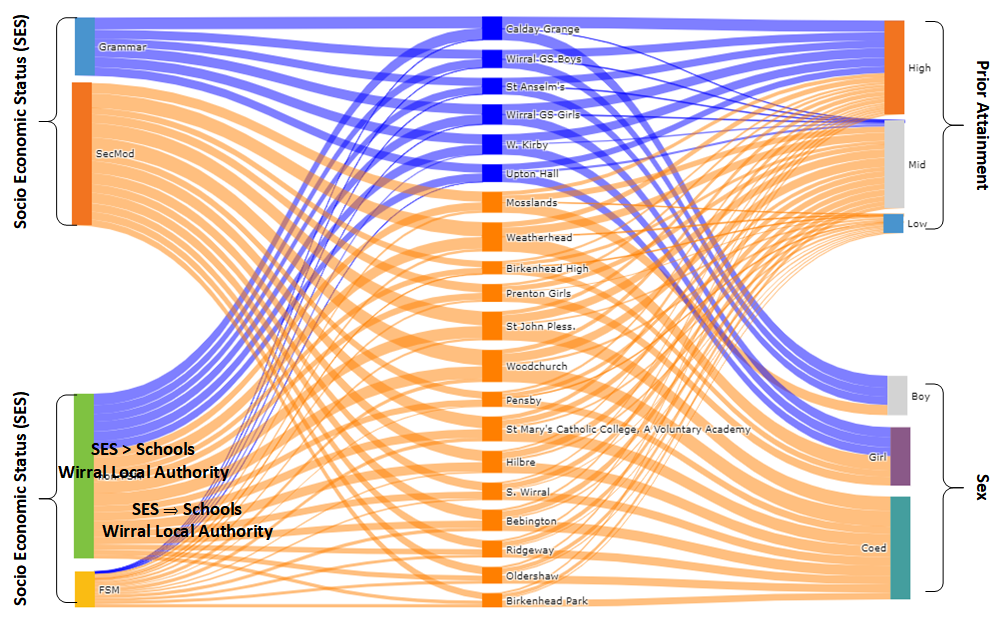
… but this groups the grammar schools together again!

The ugly!!

As promised! Plotly allows the nodes to be dragged into different positions. This was another attempt to plot four dimensions on a graph and it really doesn’t look pretty!
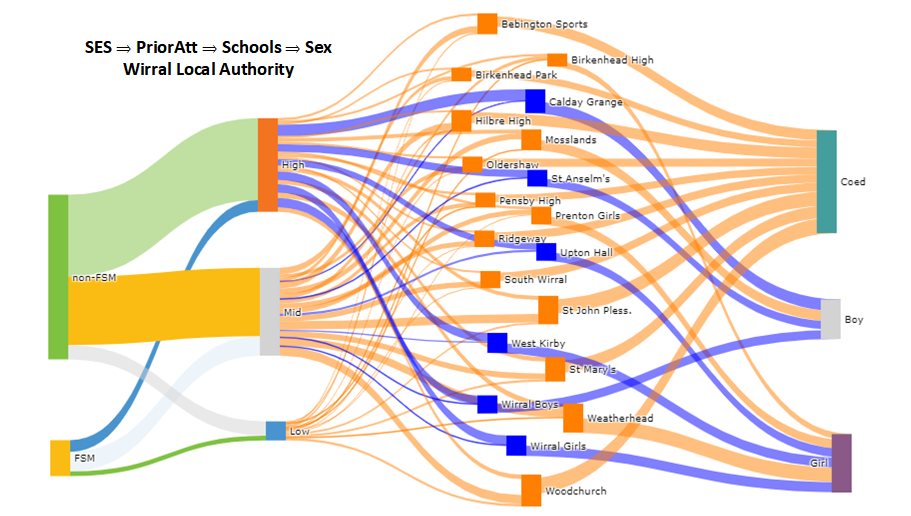
Sankey plots of secondary schools, Wirral Local Authority

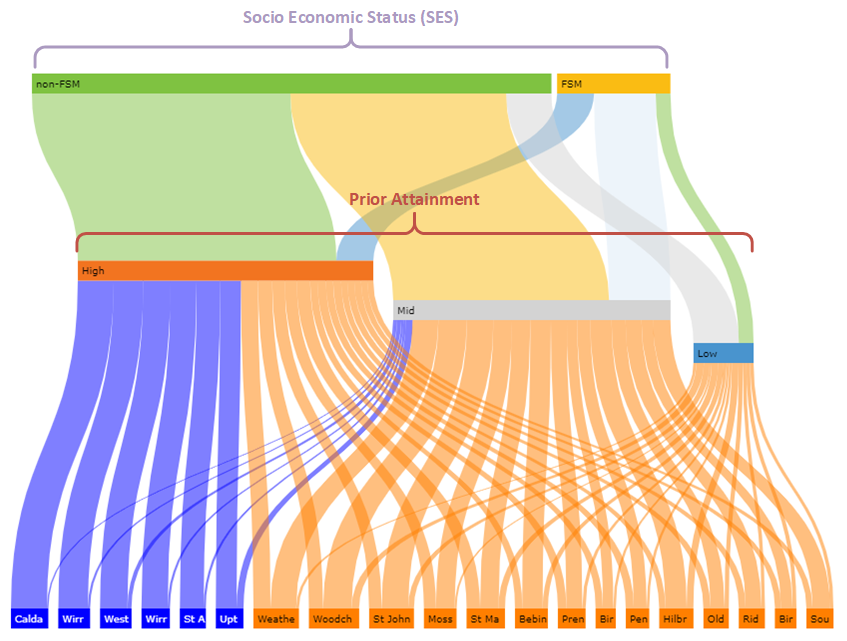
SES >> PriorAttain >> School

It’s also possible to rotate the ‘flow’ from top to bottom. This shows how children who start out disadvantaged perform lower at KS2 and in turn are less likely to get into the grammars. Some individuals will make it from the top right to bottom left but they’re the exception. These are the anecdotes trotted out to support the claim that grammar schools promote social mobility.
Sex AND [SES >> PriorAttain] >> School

The right hand side of this last plotis as per the above but single sex admissions are added as a second input on the left. As previously noted, a limitation of the Sankey is the schools are really double the width they should be, but this still provides a good understanding of how single sex entry and socioeconomic status (SES) interact in Wirral’s secondary schools.

One final idea is to change the sex category. Instead of categorising each school’s overall sex admissions policy as [Coed|girl|boy] capture the numbers of girls and boys at each school. The ‘sex’ dimension (top left) would contain just the two nodes boy or girl. Coed schools would have a pipe leading from each. Single sex schools would have just one.

This might highlight some of the issues that single-sex entry creates in terms of narrowing choice, however it neds a lot of restructuringt the data, so that’s one I’m leaving for a rainy day!

The code

The actual plotting of these diagrams only requires a few tens of lines of code. The hard bit is defining two data structures, one for the nodes, the other for the links. I found an effective way to do this was to use Excel’s concatenate function to write the code to set these variables then copy and paste into the program. The Excel spreadsheet and a Jupyter Notebook which does the actual plotting can both be found on GitHub.

Sankey Trivia

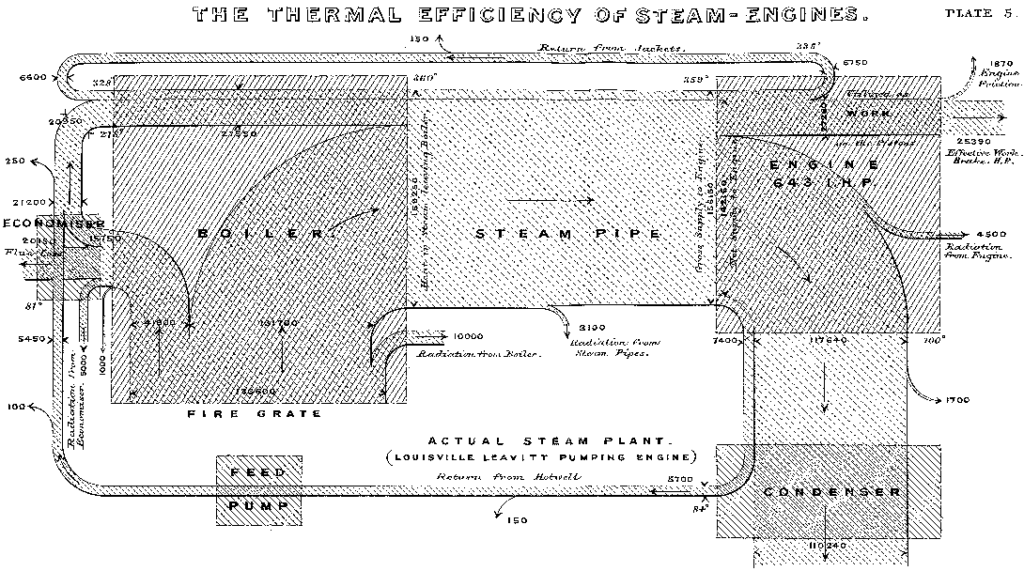
These ultra-modern looking diagrams are named after the Victorian industrialist Captain Matthew Henry Phineas Riall Sankey. In 1898 he created this map of energy losses in a system, representing the amount of energy by the width of the ‘pipes’.
Sankey gave his name to this type of chart, but he was very much building on the work of others. Half century earlier, in 1845, pioneer of statistical graphics Charles Minard plotted the traffic between Dijon and Mulhouse using the thickness of lines to represent volumes. Minard is best known for his 1869 Tableau Graphique of Napoleon’s march on Moscow.
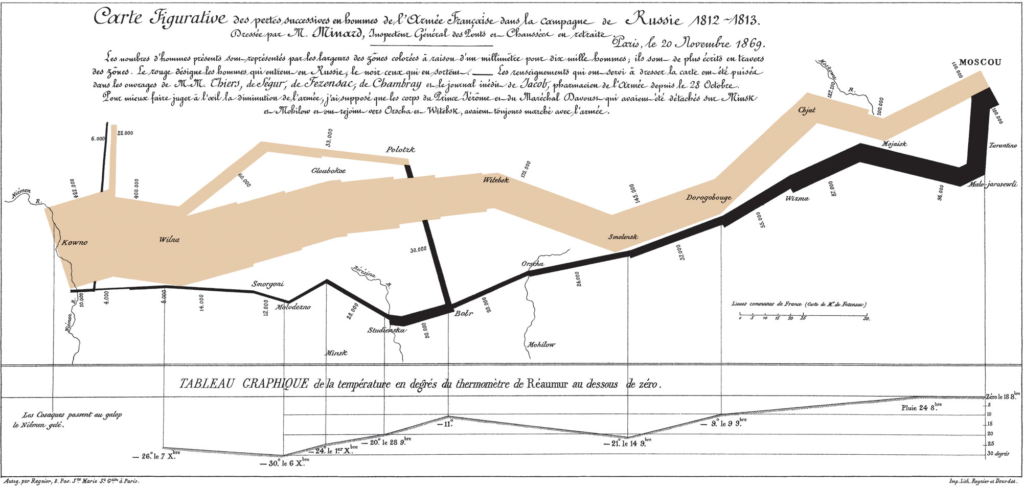
This graphically plots the demise of the 422,000 strong army that started out in 1812. Each millimetre represents 10,000 men; beige showing the advance and black the retreat. Less than a quarter made it to Moscow. Of those only 10,000 made it back to Poland.
rubber standardisation

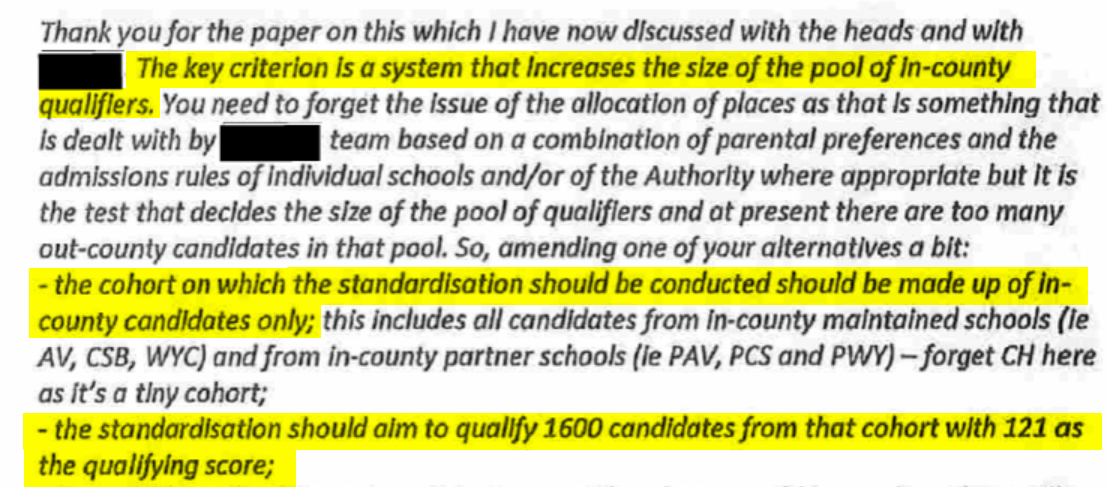
In 2018, the Times Education Supplement published an article, Grammar heads wanted admissions that would illegally favour local pupils. A couple of years later the underlying events cropped up in court proceedings. These did not address the question of legality but did unearth a whole lot of evidence revealing the very non-standard way 11-plus tests were being “standardised” behind the scenes.

standard standardisation.

Standardised testing is a simple concept. i) Test everyone, ii) Work out the mean and standard deviation values, iii) Use these values to show where each individual candidate sits on the ubiquitous bell-curve relative to everyone else. This is measured in standard deviations (σ) relative to the mean (μ) and typically range between ±2.5σ. That includes negative scores and decimal fractions so, by convention, these “z-scores” are rescaled so the mean μ=100 and each standard deviation σ=15 (Wiliam 2001). See the above illustration before the animation starts. The first axis shows z-scores. The second shows the equivalent standardised test scores.

non-standard standardisation

The documents disclosed in court show that in 2013 Buckinghamshire’s grammar schools were concerned that insufficient candidates were passing their test. The pass mark is 121 but changing this would require public consultation so the grammars asked their test provider to recommend “alternative approaches”. The test provider suggested keeping the mean μ=100 but increasing standard deviation to σ=90. The above animation demonstrates that the proportion of those “passing” the test increases until it is over 40%.

The test provider was also given access to candidates’ personal data, including whether they live inside or outside the county, their ethnicity, gender and primary school attended. Using this information, they suggested increasing the weighting of the Verbal Reasoning test would move 88 places from ‘out of county’ candidates to ‘in county’ and even discussed how they could modify the gender balance of the candidates that qualified.

The grammar schools instructed their test provider to ensure the test was “standardised” in such a way to ensure that 1,600 ‘in county’ candidates taking the test obtained the qualifying score of 121.

The key criterion is a system that increases the size of the pool of in-county qualifiers. The cohort on which the standardisation should be conducted should be made up of in-county candidates only. The standardisation should aim to qualify 1600 candidates from that cohort with 121 as the qualifying score.

The clearest way to lower the test score is to lower the test score! This gives neighbouring schools an opportunity to question this. In 2018, two of the county’s grammar schools received funding to expand. The DfE repeatedly refused to disclose how much taxpayer money was spent on this although the local press reported that John Hampden Grammar School’s share was £3 million. At 38.6%, Buckinghamshire has the highest proportion of children studying in grammar schools (DfE Data n.d.) in the country. Several sources have warned about the damage this causes to neighbouring schools (Spens et al. 1938; Gewirtz, Ball, and Bowe 1995; Andrews, Hutchison, and Johnes 2016; Allen 2016a, 2016b).

rubber standardisation

Commercial test providers have claimed in court, with diminishing success, that the way they standardise 11-plus tests is their “intellectual property“. To understand how this works, imagine the scores are plotted on the usual bell curve the but scale along the bottom is written on rubber. This can be stretched or shrunk (changing the standard deviation). It can be shifted left and right (changing the mean). This means no matter how candidates actually perform in the test, the results can be “standardised” after the event to guarantee the required number of them “pass” for the selective schools fill all their places with a few spares on the waiting lists. Laying commercial claim to basic arithmetic functions (+, -, ×, ÷) seems a bit of a stretch, but I want it on record that I came up with the superlative marketing drivel Rubber Standardisation[TM] to describe this practice.

updated October 2026

This blog was originally written in 2020 but the original animation was truly awful. This was recreated using the Python Manim (Mathematical Animation) library, created by the extraordinarily talented Mathematical YouTuber @3Blue1Brown (aka Grant Sanderson). The article was also updated although not the primary observation that any seemingly “fixed” 11-plus qualifying score is an illusion.

references

The SSEF

Has the Selective Schools Expansion Fund achieved its aims?

In 2018 Theresa May’s government announced the Selective Schools Expansion Fund (SSEF). £200m funding over four years to expand existing grammar schools. Damian Hinds explained that this would enable disadvantaged children to attend grammars, “I have always been clear that selective schools will only be able to expand if they meet the high bar we have set for increasing access for disadvantaged children, and all of these schools have done that. As a result, countless more children from disadvantaged areas will benefit from places at outstanding schools.”

Now that the first tranche of children benefitting from this policy have started school we can see how effective this £50m of public funding has been at getting more disadvantaged children into grammar schools.

Spoiler alert. It’s underwhelming.

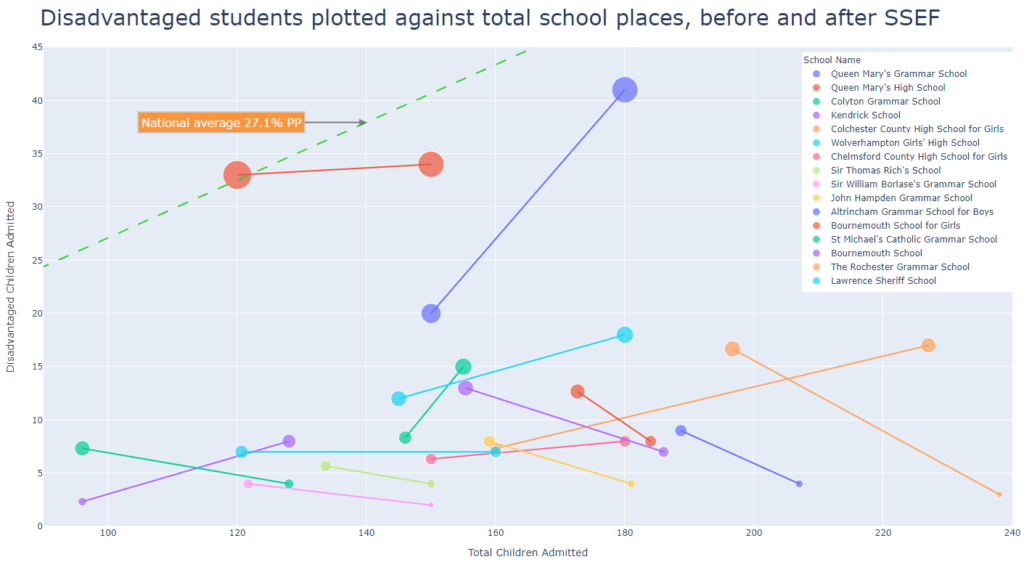
Each of the schools were asked how many offers were made and how many of them went to disadvantaged children. This plot shows the mean ‘before’ figures for 2017-2019 provided by the DfE and numbers of offers made in March 2020 provided by the individual schools.

(Clicking opens in a new window with hover over mouse tips.)

The plot shows total on roll (x-axis) against disadvantaged children (y-axis) with the green dotted line showing the national average. Each line shows the ‘before’ and ‘after’ for an individual school. Schools near the dotted green line are approaching national averages for inclusivity.

Crystal ball work

I told The Guardian in February 2019 that the only effective way to get grammars to admit representative numbers of disadvantaged children was to implement a quota system. Only two schools come anywhere near to reflecting the normal proportion of disadvantaged children – the two “St Marys” in Walsall. Both set aside 30% places for disadvantaged children.

  • Queen Mary High (Girls – red line) had already implemented quotas before the SSEF. All credit to the governors’ principles, but the SSEF didn’t contribute to this achievement.
  • Queen Mary Grammar (Boys – blue line) introduced quotas as a condition of the grant and the effect is marked. This is the only school which has seen a significant improvement.

Based on a closer look at the actual proposed admissions arrangements and past test results, I predicted at best 2 or 3 of the thirty new places being created at Kendrick School in Reading and Buckinghamshire’s William Borlase’s and John Hampden would go to disadvantaged children.

Kendrick exceeded this, increasing their mean intake of two and a third children out of 96 (2.4%) to eight out of 128 (6.25%). This is heading in the right direction but still a long way to go. By contrast Buckinghamshire’s William Borlase’s and John Hampden appear to have gone backwards.

  • William Borlase reduced the number of disadvantaged children admitted from 4 (3.3%) down to 2 (1.3%)
  • John Hampden reduced the number of disadvantaged children admitted from 8 (5%) down to 4 (2.2%)

Altrincham School said their target was to admit 15% disadvantaged (still only half the national average) by 2023. They have dropped from admitting 4.8% (9) to less than 2% (4)

The policy

The SSEF policy handed out cash to schools who promised to do something to address the underrepresentation of disadvantaged children in grammar schools with no sanctions for those which failed. The only two which approach normal numbers of disadvantaged children were already operating a quota system before the grant was awarded. The grant made no difference.

If the government were serious about funding places for disadvantaged children the sensible way to do this would be to fund new ring fenced places which don’t “take away” places from the middle classes. The SSEF created an additional 500+ Y7 places – 2,500 places in total. That’s the equivalent of building three entirely new grammar schools. Of those five hundred Y7/2020 places, eleven* went to disadvantaged children at a cost of £4.4 million per disadvantaged child.

The SSEF was Theresa May’s method of circumventing primary legislation which outlaws the creation of new selective schools. Who could’ve seen that one coming in 2018?

*Caveat

The figures shown here are based on offers made in March 2020. Schools Week published an article based on this information (£50m for expansion, but some grammars get less inclusive) but included corrected figures for numbers of disadvantaged children who actually started in September. Between them seven of the schools originally said they had made 51 offers to disadvantaged children but 89 subsequently joined.

This appears to be because secondary schools genuinely do not know which children are entitled to PP funding until they start school in September. This means the above graph is probably pessimistic, but if parents of disadvantaged children don’t even realise that they have preference in the admissions process, the schools are clearly not getting ths message across.

The SSEF policy was announced in 2018 but due to the long ‘lead time’ in changing admissions, the official reporting of Pupil Premium numbers won’t be captured until the next spring census. We need to wait until April 2021 to fully understand the effectiveness of the Selective Schools Expansion Fund.

Bucks Grammar test error

I originally wrote this blog in 2019 shortly after the BBC reported the Bucks 11+ test had contained “impossible-to-answer” questions. I have rewritten it to correct some assumptions, but the main contention, that it is not possible to remove questions from a test without impacting reliability, remains unchanged.

In 2019 Buckingham Grammar Schools (TBGS) and their test provider Granada Learning Associates (GLA) removed eight questions from the Verbal Reasoning (VR) assessment. They told parents this did not impact reliability. A group calling itself The Parental Alliance for Choice in Education described those claims as, “… a deliberate act of misdirection.”

Number of VR questions

TBGS say the number of questions in their test is a Trade Secret. This is despite the fact that ten thousand children sit the test every year. They have argued in court that if they disclosed the number of VR questions tutors would use that to game the test. Despite this refusal to be open and transparent, it is possible to estimate this from other sources. GLA’s guidance shows their standard VR assessment has 80 questions set over 60 minutes. Children have 45 seconds to complete each question. TBGS allow just 20 minutes for VR, limiting the number of questions to about 27 or 28. With 8 questions removed the 2019 VR results would have further reduced that to about 20 questions.

Reliability

Each time a candidate takes a test they get a different score. Retest reliability is a measure of how consistent the score is between tests. This theoretically ranges between

  • 100%: Scores are exactly the same each time.
  • 0%: Scores are completely random. 

Prof Dylan Wiliam explains (2001) “There are only two really effective ways of increasing the reliability of a test: make the scope of the test narrower, so you can ask more questions on the same topic, or, what amounts to the same thing, make the test longer.” This confirms common sense. If it was possible to remove questions from the test without reducing reliabiity we could just remove them all and still have a reliable assessment!

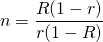
The starting point to working out the actual reliability is the technical information published by GLA. When their Verbal Reason has 75 questions its reliability is 81%. Wiliam explains, “In general if we have a test of reliability r and we want a reliability of R, then we need to lengthen the test by a factor of n given by”:

(1)   \begin{equation*} n = \frac{R(1-r)}{r(1-R)} \end{equation*}

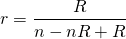
By rearranging† for r we can turn the question around and ask what effect altering the number of questions has on reliability.

(2)   \begin{equation*} r = \frac{R}{n-nR +R} \end{equation*}

n is the ratio of questions between different length tests. The calibration test had 75 questions and initial reliability is R=0.81. For the normal Bucks VR test n=75/28. Plugging these values into equation (2)

(3)   \begin{equation*} r = \frac{R}{n - nR +R} = \frac{0.81}{\frac{75}{28}-(\frac{75}{28} \times 0.81) + 0.81} \approxeq 0.614 \end{equation*}

When 8 questions were removed in 2019 n=75/20. Plugging these values into equation (2)

(4)   \begin{equation*} r = \frac{R}{n - nR +R} = \frac{0.81}{\frac{75}{20}-(\frac{75}{20} \times 0.81) + 0.81} \approxeq 0.532 \end{equation*}

Inconsistencies

In 2020, the TBGS website FAQ page said, “In relation to the reliability of this year’s Secondary Transfer Test … our analysis has found that the overall reliability of the test has not been compromised. The results indicate that both the Verbal Reasoning and English sections score well above 0.80 reliability, which is considered to be very good.”

TBGS need to explain how a test which has a reliability of 0.81 (81%) when it has 75 questions can still have a reliability of “well above 0.80” when three quarters of the questions have been removed.

†Rearranging Wiliam’s formula

The steps in getting from equation (1) above to (2) are:

(5)   \begin{equation*} n = \frac{R(1-r)}{r(1-R)} \end{equation*}

(Multiply out RHS denominator)

(6)   \begin{equation*}n × r(1 - R) = R(1 - r)\end{equation*}

(Multiply out brackets)

(7)   \begin{equation*}nr - nrR = R - rR\end{equation*}

(Add rR both sides)

(8)   \begin{equation*}nr - nrR +rR =R\end{equation*}

Factor out r LHS

(9)   \begin{equation*} r(n - nR +R) =R \end{equation*}

Divide by n -nR +R

(10)   \begin{equation*} r = \frac{R}{n-nR +R} \end{equation*}

ICO uphold scrutinisation of grammar expansion money

The Information Commissioner has recently ruled against a grammar school’s refusal to reveal information relating to it being allocated millions of pounds of public money to expand under the Selective Schools Expansion Fund.

(Updated 6 Aug) The ICO have now pubished the full report which rejected the school’s claim that asking for details of their plans to expand was vexatious and concluded this website clearly campaigns for improved access to selective schools for pupils from disadvantaged backgrounds … the Commissioner considers this to be legitimate issues of public concern, in terms of increasing the educational opportunities for children from less advantaged backgrounds and in respect of scrutinizing government policy in this area and transparency of how public money is spent.

Lord Watson submitted a written question asking whether the government would publish bids of successful applicants of the SSEF. SoS for Education Lord Agnew has replied that the DfE will not be publishing full SSEF bids “as they contain commercially sensitive information”.

Canterbury Choices

Parents choice over which school their children attend is theoretically sacrosanct but in practice restricted whenever schools implement selection by aptitude faith or gender.  Queen Elizabeth Grammar School in Faversham, which selects on ability, have recently consulted on opening an ‘annexe’ in another town.  This prompted a request to enhance my map of England’s selective/non-selective secondary schools to include Kent’s faith schools.  I decided to add gender, numbers on roll and the average prior attainment (KS2APS) based on DfE figures.  Here’s a link to the map.

Kent Secondary Schools

Queen Elizabeth Grammar explain they based their expansion bid on the five-year plan published by Kent County Council (KCC) which sets out the council’s desire to establish a five form entry (5FE) ‘satellite’ grammar provision on the coast.  Grammar schools opening an ‘annexe’ tends to be controversial. The Canterbury District is broken into three planning areas;

  • Canterbury City Non-Selective,
  • Canterbury Coastal Non-Selective and
  • Canterbury and Faversham Selective. 

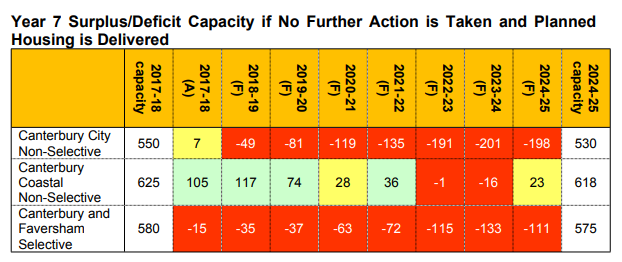
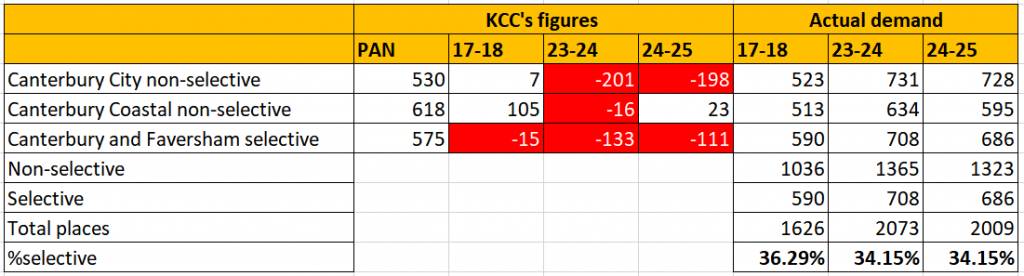
KCC’s plans explain, “If new housing is delivered in line with the Local Plan it is forecast that there will be a gradual increase in the need for Year 7 places across the Plan period, increasing from 37 in 2019 to 133 by 2023.”  The supporting figures appear in this table:

Table from Commissioning Plan for Education Provision in Kent 2019 – 2023 (page 81)

Instantly this looks wrong.  Each planning area has roughly the same capacity and so grammars provide about a third of the places but Kent’s policy is for 25% of pupils to attend grammars. 

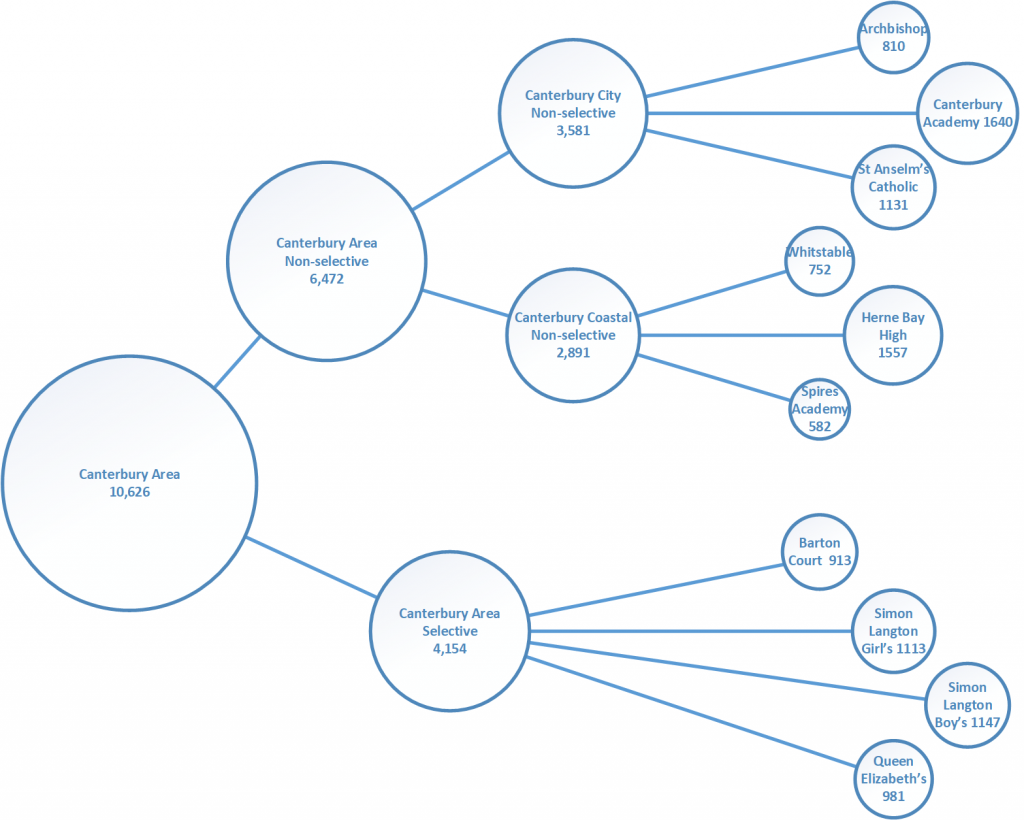
Before leaping to any conclusions, the table does predict even more demand for non-selective places so these figures need to be examined in more detail.  Taking 2017-18 DfE figures for pupils actually on roll, the schools in these three planning areas can be represented graphically and taxonomically thus:

Bubble diagram – Canterbury Schools by current attendence

The surprise is that 39% of the children in the Canterbury area already attend a grammar school, over one and a half times the council’s target of 25%.  This also shows there is very poor choice Canterbury City for parents seeking an inclusive secular education for their children.

The actual demand for places can be extrapolated from the table above by subtracting the surplus/deficit from the total published admissions numbers (PAN) for each planning area in the rightmost column. For example there are 530 places in the non-selective city schools and a predicted 2024-25 shortfall of -198 so demand is 530 – (- 198) =728.  Demand for places peaks in 2023-24, so taking just the first, peak and last years’ values from the 5 year forecast we can add further columns to show actual demand for places then combine the two non-selective planning areas to arrive at the proportion of selective places in this forecast. 

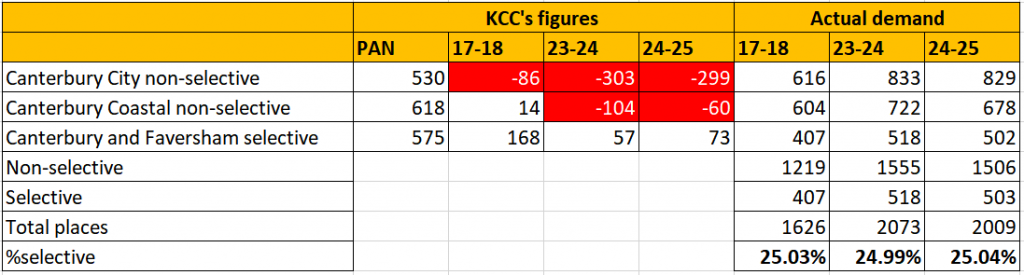
Kent County Council’s forecasted requirement for 133 grammar school places by 2023-24 is based one third of the places being selective even though their policy is for this to be 25%.  If we rewrite this table from the ‘bottom up’, so that 25% of the capacity is satisfied with grammar school places it looks like this. 

This now shows that with no expansion there is a shortfall of about 400 non-selective places but a surplus of selective places even at the peak period of demand 2023-24. 

A circular argument?

This questions why KCC planners think the Canterbury area needs a further 150 places per year when the bubble diagram above shows almost 40% of the children in the area already attend grammar schools.   

Can we really call Canterbury’s grammar schools ‘selective’ if they’re already admitting 40% of the planning area’s pupils?

Maybe they’re trying to reflect parental choice.  The problem with this approach is, if a policy aimed at admitting 25% of the cohort to grammar schools has already resulted in 40% then planning to admit 35% to grammar schools is likely to push that figure over 50%. That will in turn drive demand even further by parents who don’t want their children to be the ones who just miss out on a grammar school place wherever that line has been drawn.

An alternative suggestion

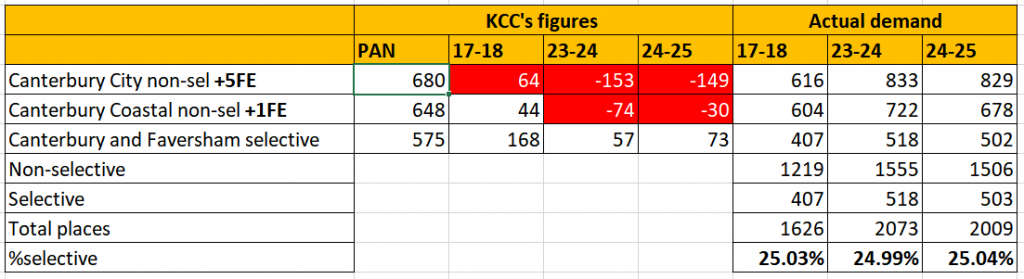
The KCC plan explains approval has been given to open a new 5FE (150 places) school on the site of the Chaucer Technology School which closed in 2014. They’d also like to expand Herne Bay by 1FE (30 places).  Adding both of these to the 5-year demand forecast results in the following:

There still remains a requirement for a further 5FE school in Canterbury City as well as two forms in the coastal area which might be satisfied by expanding either Whitstable or Spires Academy. If Kent County Council follow their own policy of providing 25% places in grammar schools, they do not need an ‘annexe’ in the Canterbury area which would force children to travel to different towns once a week just so the primary legislation which outlaws the creation of new grammar schools can be subverted.

The above tables are available in this annotated spreadsheet.

How to define Secondary Modern.

The term Secondary Modern dates back to the 1944 Education Act which streamed children based on of presumed different intellectual ability into different schools and so a de-facto definition of Secondary Moderns would be the other schools you get when you create grammars.   As Sir Michael Wilshaw (2016) put it, “Every time you create a grammar school you create three secondary moderns” adding that no-one was queuing up to attend the latter.  A negative perception the National Association of Secondary Moderns (NASM) are doing an excellent job of challenging.

The DfE recently added another field to the NPD defining secondary schools as one of the following three types

  • Selective (163)
  • Non-selective in highly selective area (225)
  • Other non-selective (2,930)

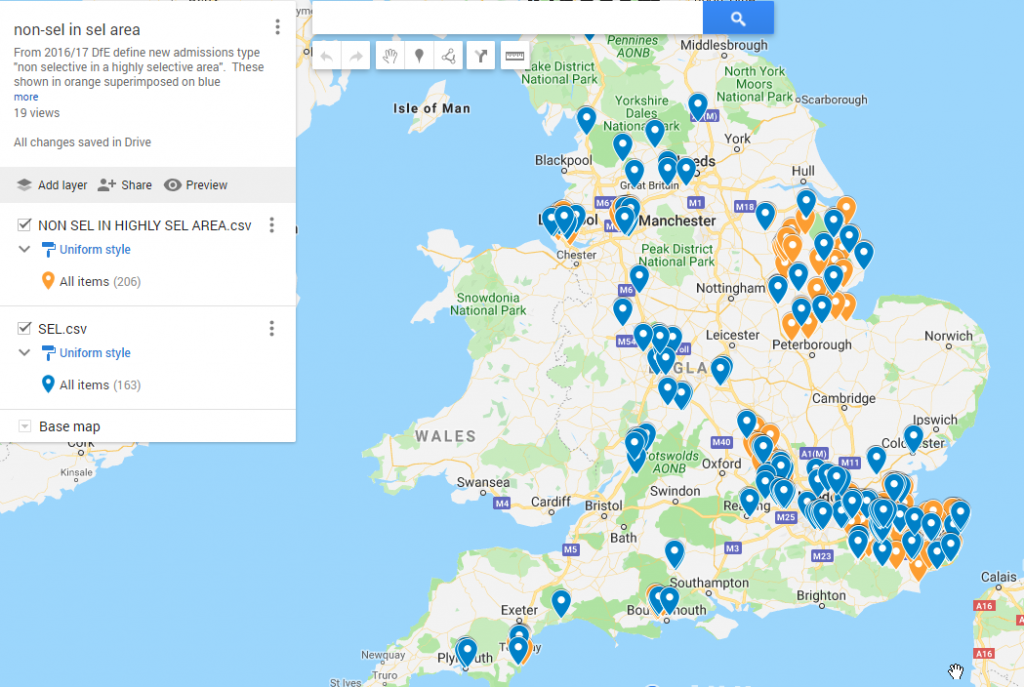
It’s says a lot about our policy maker’s obsessions with selection that the country’s 3,000 secondary schools are now defined in terms of their proximity to a handful of grammars.  If the DfE must insist on using a euphemism to avoid describing what’s really occuring I’d rather they picked something which wasn’t quite such a mouthful.  I’m just going to stick with calling them Secondary Moderns and stary by observing that plotting these on a map doesn’t present any surprises. 

Interactive map showing ‘Secondary Moderns’ and Grammar School

Becky Allen, Director of the Centre for Education Improvement Science at UCL, wrote an article (which I’d forgotten about when I first looked at this) asking When is a comprehensive school actually a secondary modern? She looked at both ‘recruitment neighbourhoods’ as well as prior attainment but still treated Secondary Modern as an absolute binary variable. A recent exchange of ideas with NASM (who the DfE would have us calling The National Association of non-selective schools who’ve found themselves next door to grammar schools) revealed that we both think that the definition of Secondary Moderns shouldn’t be binary.  Some schools are more Secondary Modern than others which got me thinking about how you would go about defining them as a continuous variable.

Distance

The obvious starting point is distance because what makes a Secondary Modern is some of its children have gone to a nearby grammar school. Any areal based influnces reduce by the square of the ‘influencing’ neighbour’s distance so this should follow an inverse square law. Andrews et al (2016) found 90% of grammar school pupils in rural travelled 20km or less so it would seem sensible to exclude any grammars beyond a 20km radius as having any significant effect. The ‘influence’ is also directly proportionall to the number of places at the grammar so we could start by looking at the sum of all grammar school places within 20km, divided by the square of their distance:

(1)   \begin{equation*}     \sum_{1}^{n}{\frac{1}{d^2}},  \forall n  \in  GrammarPlaces, d \leq 20km \end{equation*}

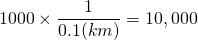
That gives a Secondary Modern-ness ‘score’ with a theoretical unlimited upper limit.  For example, a non-selective school situated 100m from a grammar school which has 1000 pupils would have a Secondary Modern-ness score of

(2)   \begin{equation*}   1000 \times \frac{1}{0.1(km)}=10,000 \end{equation*}

To put this in to more readily understood terms we really want a range of values from (0%) where grammars have no effect to (100%) which is our ‘fully secondary modern‘.  One way to do this would be to assume as the DfE have that Kent’s non-selective schools are all 100% Secondary Moderns, pick the lowest scoring of these as a constant k and dividing the result by this:

(3)   \begin{equation*}     \frac{1}{k}\sum_{1}^{n}{\frac{1}{d^2}} \end{equation*}

What about ‘Super Selectives’?

The problem with this model is it doesn’t really work for super selectives; those isolated grammar schools which, because they’re not in fully selective counties, have been able to hoover up all the top prior attainment pupils from a really wide area.  Over the years such schools have become ever increasingly selective at who they accept. Due to the lack of any regulation of entrance tests it’s hard to quantify how selective these schools are but compared to fully selective Kent, which aims to select the highest 25% attainers, Super Selectives might select only the top 5% from a catchment area five times as populous.

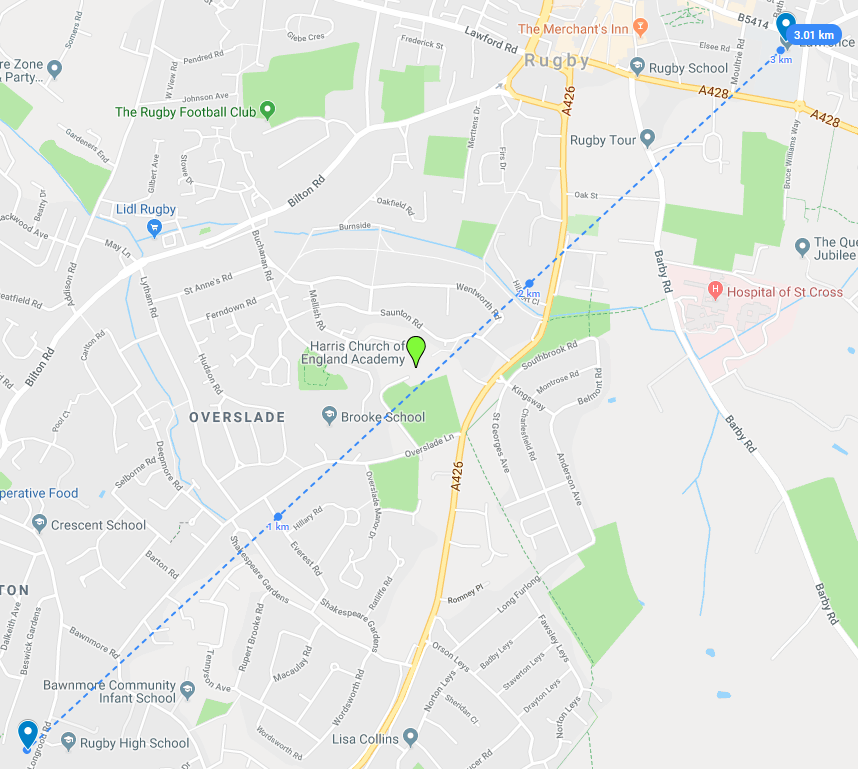
The town of Rugby has two grammars, Lawrence Sheffield and Rugby High School about 3km apart. Situated right in the middle of them is the Harris Church of England Academy.

Rugby’s grammars and Harris CoE

Based on formula (3) the Harris CoE Academy would be very Secondary Modern but the impact of the two grammars on this school actually depends on their admissions policies. To understand that we’re in the realm of unstructured data, searching out and decoding the individual admissions arrangements for the country’s 163 grammar schools!

A far more practical approach is to examine the data empirically to discover how far children are travelling to the grammar schools and include that as {\mu_g} to the formula
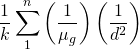
(4)   \begin{equation*}     \frac{1}{k}\sum_{1}^{n}     \left( {\frac{1}{\mu_g}} \right)   \left( {\frac{1}{d^2}} \right) \end{equation*}

This mean travelling distance {\mu_g} in equation (4) is also subject to an inverse square law based on the individual distances {d_g} each grammar school child travels so this ‘distance’ for the grammar school can be defined as:
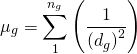
(5)   \begin{equation*}  \mu_g = \sum_{1}^{n_g}     \left({\frac{1}{\left(d_g\right)^2}}\right)   \end{equation*}

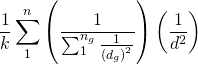
Substituting (5) into (4) we get

(6)   \begin{equation*}  \frac{1}{k} \sum\limits_{1}^{n} \left(      {\frac{1}{\sum_{1}^{n_g} \frac{1}{\left(d_g\right)^2}}} \right) \left(      {\frac{1}{d^2}} \right) \end{equation*}

This model is still not ideal

  • Rural pupils travel further than those in urban areas
  • The model lassumes the ‘grammar school effect’ is radial which wouldn’t be the case if it was on the edge of a built up area or even more a coastal town. Not many pupils live in the sea!

These could be added to the model as final refinement although that’s probaby best left until working with actual data. Having found a definition of Secondary Modern this can then be used as the explanatory variable in linear regression model to see what effects there are on KS2APS, progress and better inform the public debate over how academic selection and faith is used in the school admissions process.

Covert selection

Andrews et al (2016) found there are, “170,000 pupils attend selective schools representing 5.2 per cent of all secondary-aged pupils in state funded secondary schools.”  The EPI team were very precise with their wording but it’s all too easy to slip into the mistake of thinking from this, and all the other research which mentions 5% that this is the proportion of selective school places.  That simplification overlooks bilateral admission arrangements, where schools select only a proportion of their pupils, and those which use banding which serves one of two diametrically opposed objectives;

  1. To ensure that a school’s intake is representative of local demographics
  2. To select pupils with high prior attainment

Schools admissions provides a prime example of Goodhart’s law in action.  As soon as a measure (GCSE results) becomes a target it ceases to be a good measure (of the school).  The reason any school given half a chance will select for high prior attainment is this is the single highest contributory factor to final GCSE results.  As Gorard and Siddiqui observed (2016), “This seems to confuse some commentators, members of the public and even policy-makers who assume that the good results are largely due to what happens in the school rather than the nature of the children selected.”

The 1998 School Standards and Framework Act (SSFA) 1998 outlawed the creation of both fully and partially selective schools but didn’t attempt to alter any existing arrangements.  The DfE keep separate tabs on fully selective grammar schools but oddly make no distinction for partially selectives.  Officially, any school which isn’t 100% fully selective is comprehensive.

One such “comprehensive” school is Thomas Telford in Shropshire which uses banding as part of its admissions process.  The school’s admissions criteria states, “the intake is representative of the full range of ability and broadly representative of the community in the catchment area“.  DfE data tells a very different story.  78% of the school’s intake have high prior attainment, as compared to 35% nationally.

Selection isn’t a simple binary attribute any more than socioeconomic status or dyslexia.  There is really a whole range of selection going on.  Even within the 163 officially designated fully selective schools, some very clearly regard themselves as more selective than others.  The lack of regulation and opacity surrounding the entrance tests makes any objective study of the effects of selection almost impossible.

If just one in twenty of the 3,300 secondary schools the DfE officially designate as comprehensives are selecting their pupils then we have the bizarre situation in which there are more selective “comprehensives” than grammar schools!  This eventually boils down to exactly how “selection” is defined but any research into selection which doesn’t consider all the covert selection which takes place (which appears to be all of it!) must dramatically underestimate any conclusions.

References

Andrews, J., Hutchinson, J. & Johnes, R. Grammar Schools and Social Mobility, (Education Policy Institute, London, 2016). https://epi.org.uk/wp-content/uploads/2018/01/Grammar-schools-and-social-mobility_.pdf

Gorard, S.A.C. and Siddiqui, N. (2018) ‘Grammar schools in England: a new analysis of social segregation and academic outcomes.‘, British journal of sociology of education http://dro.dur.ac.uk/20400/1/20400.pdf?DDD34+DDD29+hsmz78+d700tmt

School Standards and Framework Act 1998 https://www.legislation.gov.uk/ukpga/1998/31/contents

The history of ‘Super-Selection’

Two events over a quarter of a century ago combined to create Reading’s two super-selective grammar schools.  The first of these was the 1988 Great Education Reform Bill, aimed at bringing the market economy to schooling through parental choice informed by performance tables.  Legislators thought this would ensure poor performing schools would either be forced to improve or close.  The problem was these performance tables only looked at the final GCSE results, the single most significant contributory factor effecting which is prior attainment.  Overnight grammar schools became officially ‘good’ simply because they only admitted children with a propensity for high achievement.  Gorard and Siddiqui (2018) summed up this over emphasis on final exam results, “This seems to confuse some commentators, members of the public and even policy-makers who assume that these good results are largely due to what happens in the school rather than the nature of the children selected.”

A year later came the 1989 Greenwich Ruling, which revolved around John Ball Primary, a very popular school in Lewisham just 200 metres from neighbouring Greenwich.  The court ruled that excluding Greenwich children, simply because they lived in a different local authority, was contrary to the newly enshrined concept of parental choice.  The economist Charles Goodhart said, “When a measure becomes a target, it ceases to be a good measure.”  Final exam results were the target and Reading’s grammars wasted no time in using the Greenwich Ruling as justification to cast their nets ever further afield to meet it.

Prior to 1990s commuting long distances to school was almost unheard of but parents, given to believe that their children would be guaranteed to thrive from attending schools with ‘good’ results, were now doing everything they could do get their children into such schools.  This created what economists call a positive feedback loop.  Reading’s grammars were already getting ‘good’ results but opening up their catchment increased competition for the fixed number of places.  This drove up the prior attainment even more which in turn raised the final exam results making the schools even more popular.

By 2008 Reading’s two grammar schools were officially recorded (National Archives 2008) as having the highest inflow of pupils with 75% of children arriving from primary schools in other authorities.  Local Authorities, also being measured on the same inappropriate target of final results, had a vested interest in retaining selection.  The same report noted, “Selective LAs gained above-average attaining pupils and lost low- attaining pupils.”

Reading’s grammars are both a short walk from the railway station and information obtained under the Freedom of Information Act data (2016) shows pupils coming from as far afield as Swindon in the west and Regent’s Park in London.  A common sentiment with Reading parents is that the schools do nothing for the local community.  In 2011 a group of local parents attempted to force a ballot on the school becoming non-selective, however the rules are so highly stacked in favour of maintaining the status quo that this failed.  In 2015 over 600 parents signed a petition asking Reading and Kendrick Schools to admit more local children.

The ‘Parental Choice’ upon which the Great Education Reform Bill was predicated is far from universal.  A child annual season ticket from Slough, where a large number of the pupils travel in from, costs almost £1,000 per year.  Another factor is the effect tutoring has on the entrance tests.  Just one additional correctly answered question might move the candidate up 20 or 30 places in the ranking.  The costs of first tutoring children to secure a place at these schools then the commuting is beyond the means of most families and the effect this has on the socio-economic makeup of the schools is stark.  Just 2.4% of Reading’s grammar schools pupils are eligible for Pupil Premium funding whilst the figure for the LA’s non-selective schools is 31.8% (DfE 2018).

School funding is per capita making it difficult for smaller schools to achieve economies of scale.  Reading Boys School recently increased their admissions to 150 pupils per year but Kendrick Girls, constrained by a site of only 2 hectares in a densely urban area, can only admit 96.  Reading school has three times the space so one option would be for the schools to combine sixth forms on Reading’s campus, freeing up space for Kendrick to expand their secondary school provision to match the 150 places offered by Reading Boys schools.

Kendrick School’s website (2018) highlights demand for places amongst the local community, “Census Data and demographic analysis data available to the Local Authority demonstrates the rise in secondary school aged students across Reading and the local areas.”  Reducing the proportion of selective admissions by 20% each year would take a total of eight years, giving both the schools and parents plenty of time to adapt to the changes.

Reducing selection by 20%/annum starting in 2020

This could be combined with a policy of giving high preferences to out of area children whose siblings obtained selective places at the school.  This would avoid splitting up families, and be welcomed by younger children faced with the stress and anxiety placed on them to do as well as their older brother or sisters.

Both schools owe their existence to Tudor wool merchant John Kendrick who left his fortune in trust to educate poor children.  Children flocking between the railway station and the schools each morning reinforce local sentiment that the schools are elitist, serving only affluent children from other towns.  Removing selection would be a suitable tribute to John Kendrick as well as return them to the original roots of what grammar schools originally stood for; to provide educational opportunities to children from all parts of society.

This article was origially written as part of a joint contribution to “Phasing out Selection” published by Comprehensive Future for the 2018 political conference season.

References

Gorard, S.A.C. and Siddiqui, N. (2018) ‘Grammar schools in England : a new analysis of social segregation and academic outcomes.‘, British journal of sociology of education.

Department for Schools, Children and Families, (2008) ‘The Composition of Schools in England’ http://webarchive.nationalarchives.gov.uk/20130321145625/https:/media.education.gov.uk/assets/files/pdf/b022008pdf.pdf

Department for Education, (2016) Response to Freedom of Information request for postal sector (the post code minus last two letters to ensure anonymity) of pupils attending schools in Reading and other authorities, https://www.whatdotheyknow.com/request/longitudinal_changes_in_the_demo

Department for Education, (2018) ‘Pupil premium: allocations and conditions of grant 2017 to 2018’ https://www.gov.uk/government/publications/pupil-premium-conditions-of-grant-2017-to-2018

Kendrick School webiste (2018) https://www.kendrick.reading.sch.uk/attachments/download.asp?file=42&type=pdf

Dedicated to my dad who would’ve championed Universal Education long before I had a clue what that even meant.

Kendrick’s admissions policy helps one quarter of a disadvantaged girl every year!

At a time when state schools budgets are being pared to the bone, the government have announced £200m to fund additional grammar school places.  A key requirement of this funding is it is for schools which have, “ambitious and realistic plans for increasing access for disadvantaged pupils”.

Kendrick School’s admissions policy appears to give preference to disadvantaged girls but on average benefits just one quarter of a girl each year.  Data provided by the DfE (spreadsheet) confirms just how ineffective their policy is.  31.8% of Reading’s non-selective school pupils are in receipt of Pupil Premium (PP) compared to just 2.1% of those at Kendrick School. 

The reason for this becomes apparent when you examine the way the Kendrick School decide who they admit.  Unlike GCSEs where there is a fixed pass mark, Kendrick set the “qualifying score” after the tests have been taken, so that it incorporates just the right number of applicants to fill all the places with a few more spare on the waiting list.

The only time disadvantaged girls benefit from Kendrick’s ‘prioritising’ them is in the rare circumstance their score puts them in the wafer thin ‘waiting list zone’ which is hardly compensation for the tutoring which more affluent applicants get in a test where just one additional correctly answered question can move a candidate up 20 to 30 positions in the final ranking

There is a 16 point gap in disadvantaged pupils achieving a level 4 or above at KS2 compared to other pupils (Macleod et al 2015).  Kendrick’s admissions policy is focussed on maximising prior attainment, and so by definition prejudiced against disadvantaged applicants even before taking into consideration tutoring. I asked the school to provide the actual figures of how many disadvantaged girls have benefitted since they modified their admissions policy to admit but they’re not going to reply until after their consultation has finished.  The only way Kendrick can possibly achieve this is by setting aside the additional 32 places for disadvantaged girls which would go some way to get the school to more accurately reflect the makeup of the local community it is supposed to serve. This would also be a fitting tribute to Tudor philanthropist, John Kendrick who left his fortune to educate the poor, leading to the establishment of Kendrick School.

UPDATED 5/7/2018

Copy of open letter sent to Kendrick School in response to consultation (original sent by email)

« Older posts Newer posts »

© 2026 TRAK

Theme by Anders Norén — Up ↑

Creative Commons License
Except where otherwise noted, the content on this site is licensed under a Creative Commons Attribution-NonCommercial 4.0 International License.